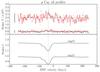
Fig. 5
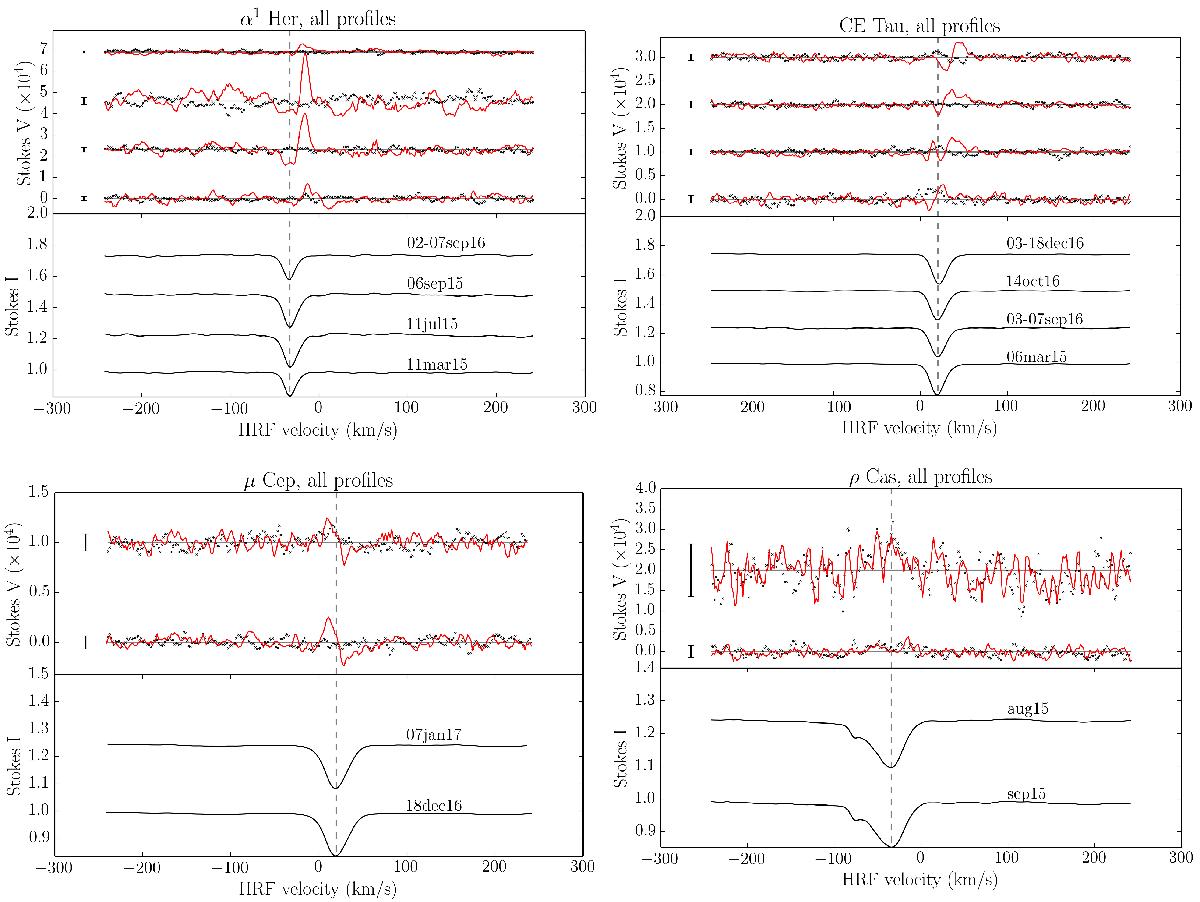
Variation of the LSD profiles of α1 Her, μ Cep, ρCas and CE Tau. For each observation point of Table 2, except for μ Cep, contiguous observations were averaged. For each star, the top panels represent all Stokes V profiles. The bottom panels represent the Stokes I profiles. For each panel the dashed vertical lines mark the mean velocity of the star in the heliocentric rest frame, the horizontal solid lines the position of 0 and the black vertical segments the mean 1σ level. The null diagnosis is shown in each panel as black crosses.
Current usage metrics show cumulative count of Article Views (full-text article views including HTML views, PDF and ePub downloads, according to the available data) and Abstracts Views on Vision4Press platform.
Data correspond to usage on the plateform after 2015. The current usage metrics is available 48-96 hours after online publication and is updated daily on week days.
Initial download of the metrics may take a while.