Fig. 3
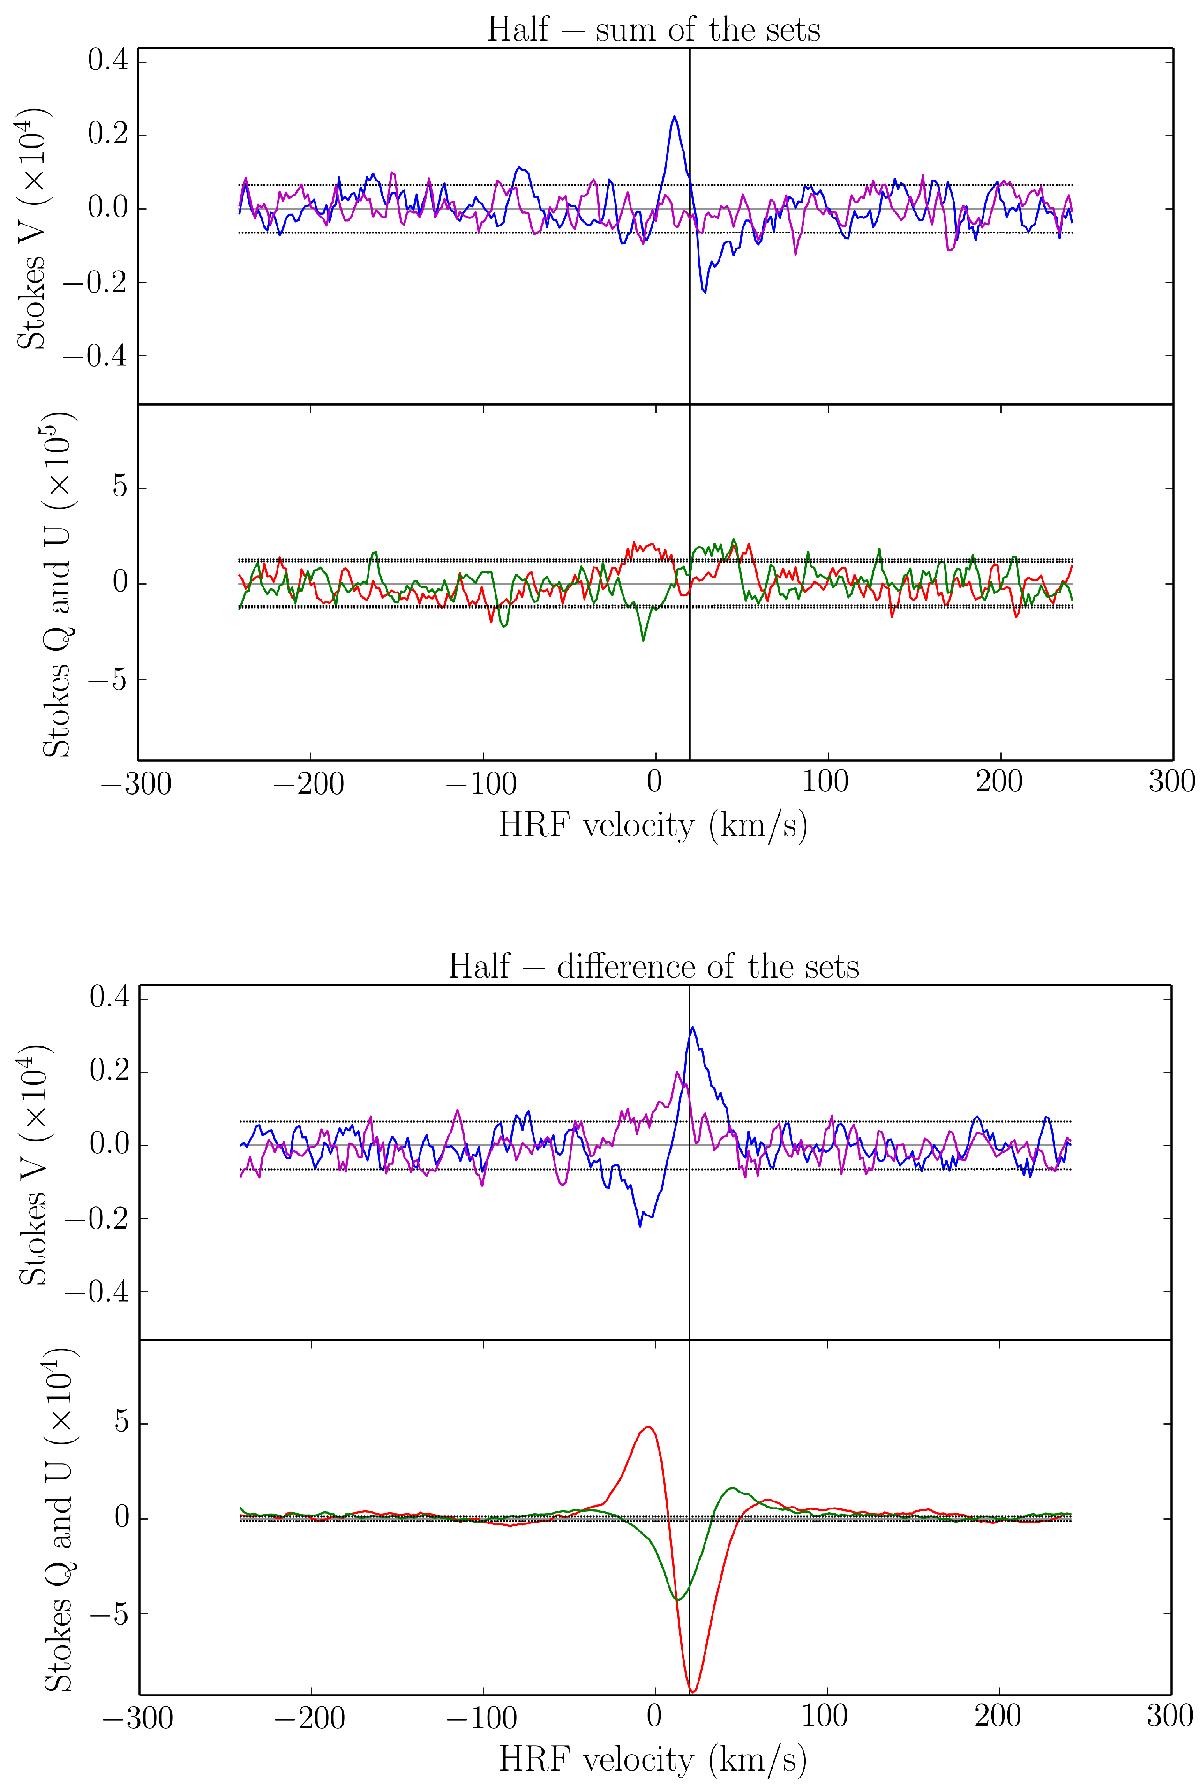
Mean Stokes V profiles (blue), null diagnosis (purple), Stokes Q (red) and Stokes U (green) profiles obtained after adding/subtracting the two sets described in Sect. 3.4.2. Upper panel shows the half-sum mean and the lower panel the half-difference mean. The horizontal dotted lines represent the 1σ level and the horizontal solid lines the 0 level.
Current usage metrics show cumulative count of Article Views (full-text article views including HTML views, PDF and ePub downloads, according to the available data) and Abstracts Views on Vision4Press platform.
Data correspond to usage on the plateform after 2015. The current usage metrics is available 48-96 hours after online publication and is updated daily on week days.
Initial download of the metrics may take a while.