Fig. 1
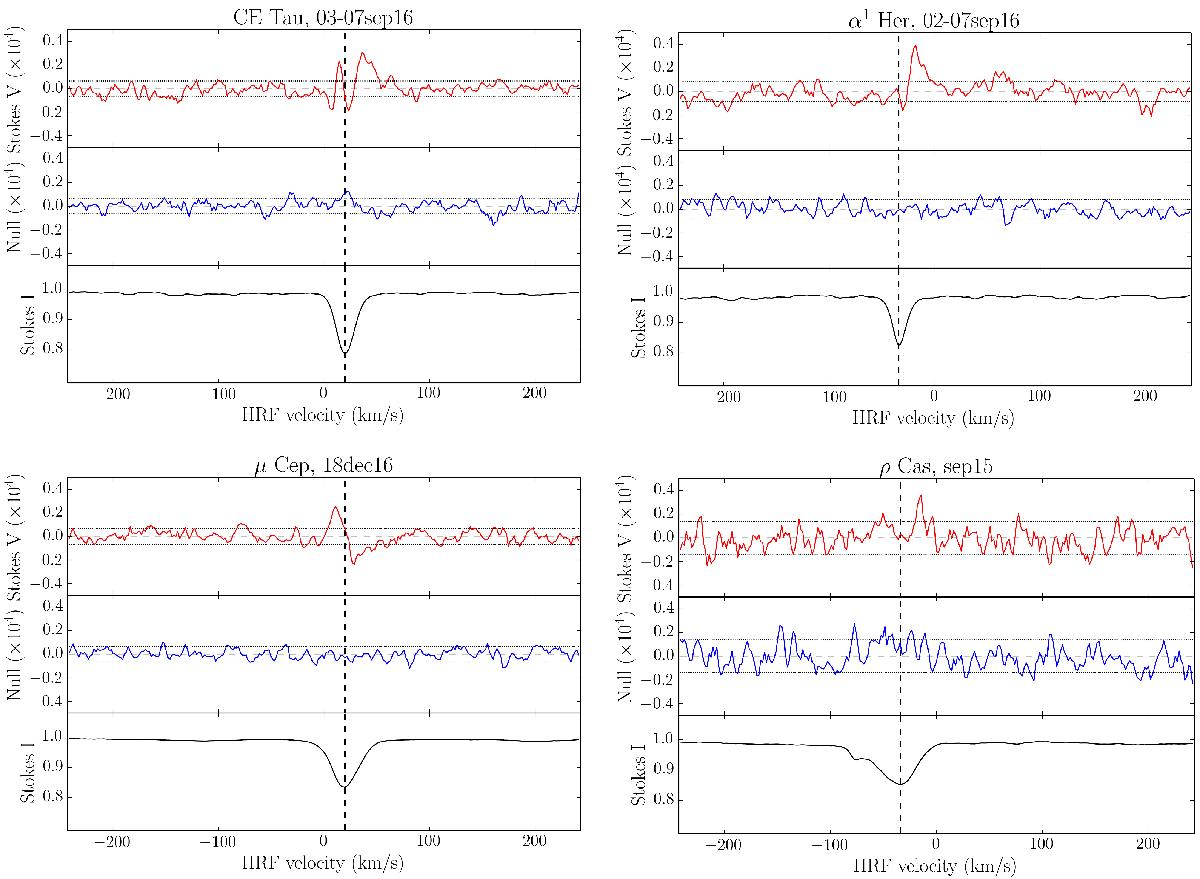
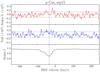
Highest S/N LSD profiles. For each panel, top plot: Stokes V in red; middle plot: null diagnosis in blue; and bottom plot: Stokes I in black. The doted horizontal lines represent the ±1σ level and the dashed horizontal lines the 0 position. The vertical line marks the radial velocity of the star in the heliocentric rest frame. The profile of μ Cep is free from linear polarisation to circular polarisation cross-talk (see Sects. 3.3 and 3.4.2)
Current usage metrics show cumulative count of Article Views (full-text article views including HTML views, PDF and ePub downloads, according to the available data) and Abstracts Views on Vision4Press platform.
Data correspond to usage on the plateform after 2015. The current usage metrics is available 48-96 hours after online publication and is updated daily on week days.
Initial download of the metrics may take a while.