Fig. 6
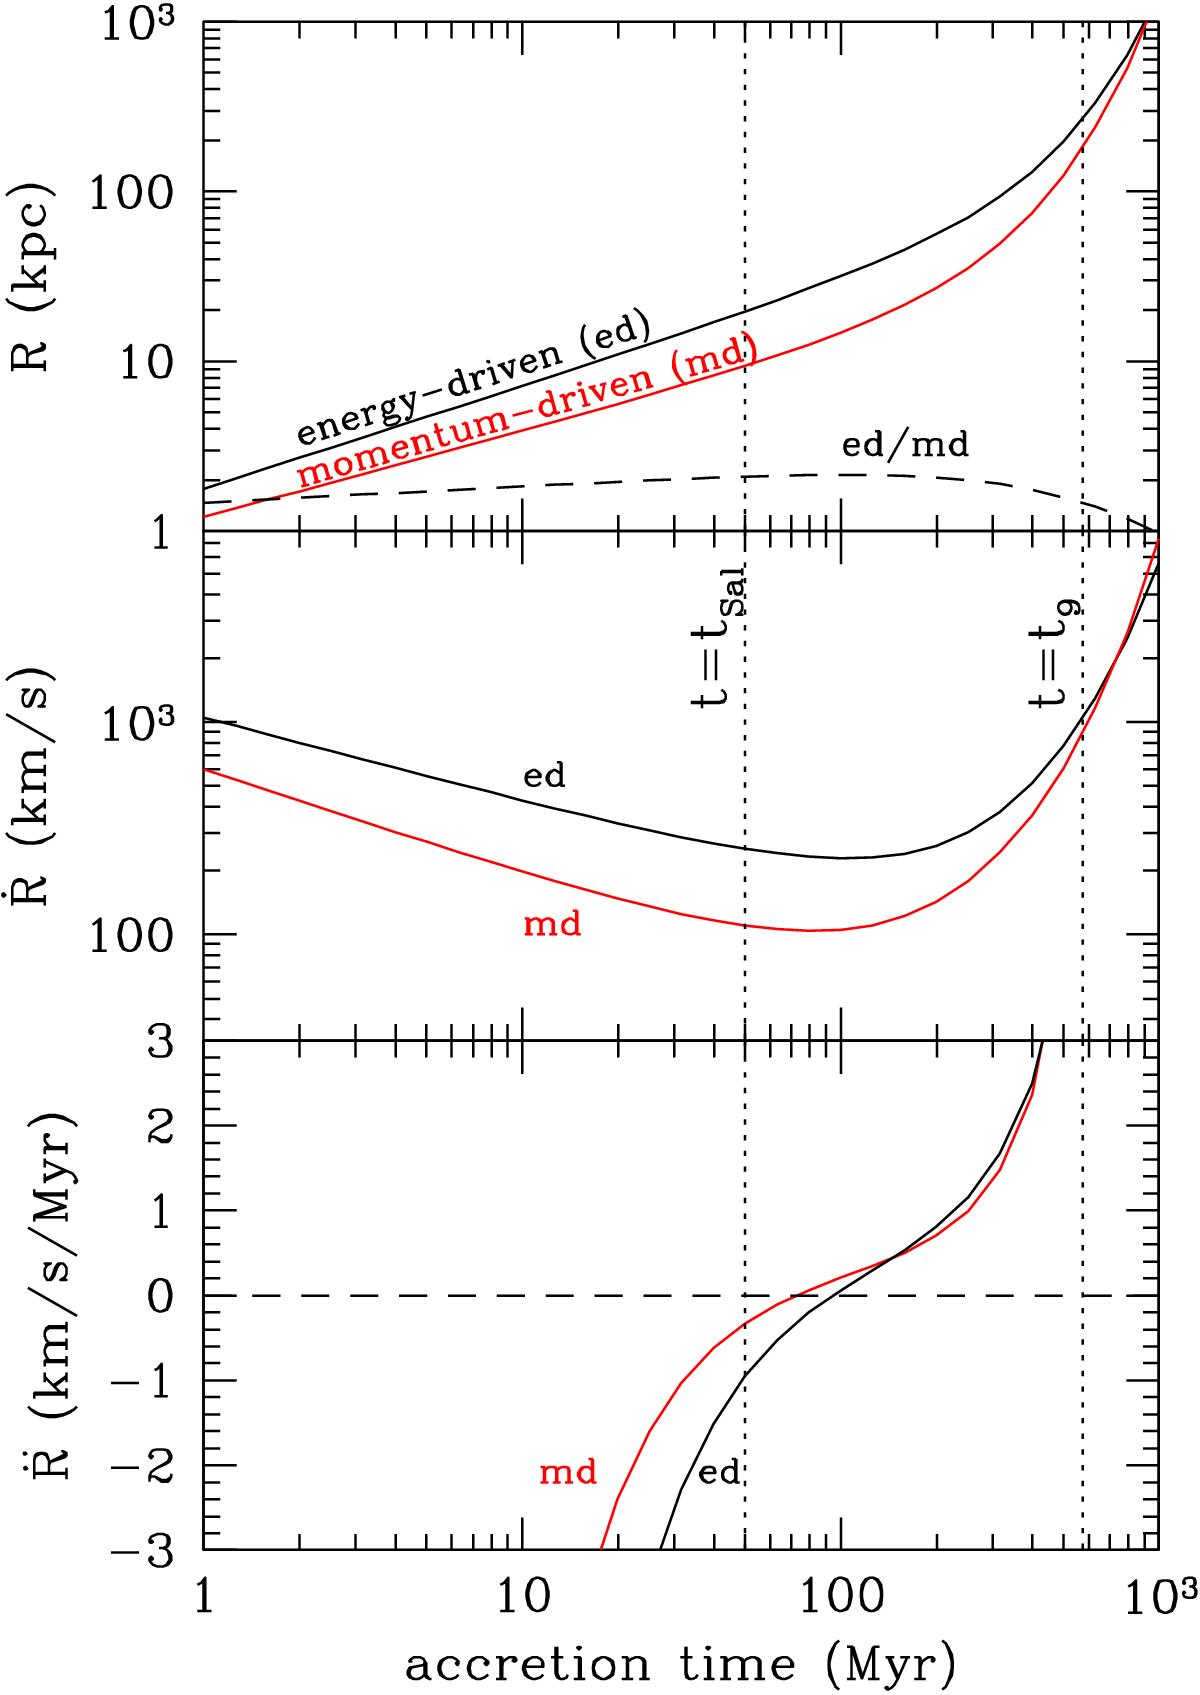
Comparison between the time evolution of the shell radius (top panel), velocity (middle), and acceleration (bottom) for an outflow produced by an exponentially growing BH in the energy-driven (black curves) and momentum-driven (red curves) limits. The source input parameters are as in Figs. 2 and 5. The ratio between the two radii is plotted as a dashed curve in the top panel. The vertical dotted lines are as in Fig. 2. At any given time, the energy-driven outflow is about two times more extended and faster than the momentum-driven outflow (apart from very late times, t> 1 Gyr, where the ejected wind mass becomes comparable with the shell mass and our treatment is inaccurate).
Current usage metrics show cumulative count of Article Views (full-text article views including HTML views, PDF and ePub downloads, according to the available data) and Abstracts Views on Vision4Press platform.
Data correspond to usage on the plateform after 2015. The current usage metrics is available 48-96 hours after online publication and is updated daily on week days.
Initial download of the metrics may take a while.