Fig. 2
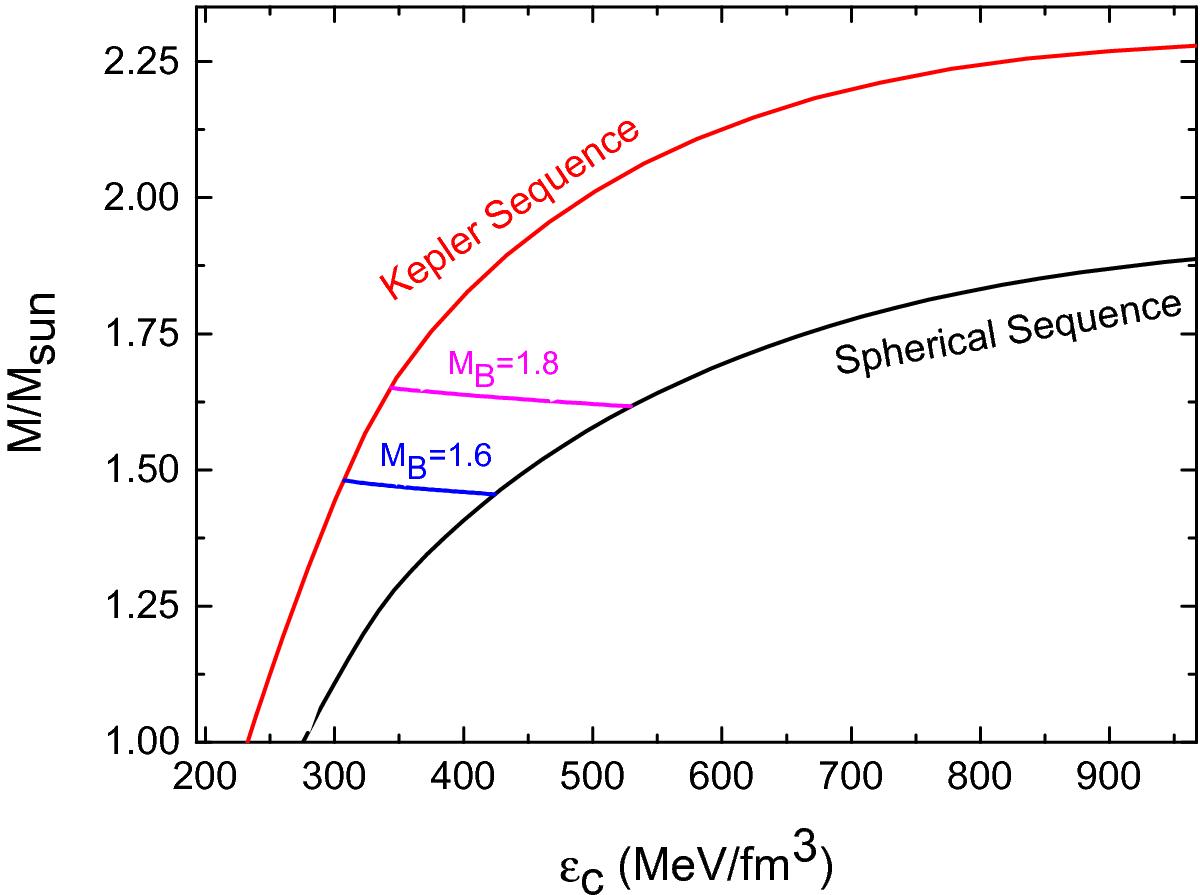
Mass as a function of central density. The blue and magenta curves depict sequences of constant baryonic mass of 1.6 and 1.8 solar masses, which are limited by the spherically symmetric stellar sequence (Ω = 0) and the Kepler sequence (Ω = ΩK). Such curves represent the evolutionary path taken by isolated neutron stars during their spin-evolution (and the corresponding increase in central density).
Current usage metrics show cumulative count of Article Views (full-text article views including HTML views, PDF and ePub downloads, according to the available data) and Abstracts Views on Vision4Press platform.
Data correspond to usage on the plateform after 2015. The current usage metrics is available 48-96 hours after online publication and is updated daily on week days.
Initial download of the metrics may take a while.