Free Access
Fig. 4
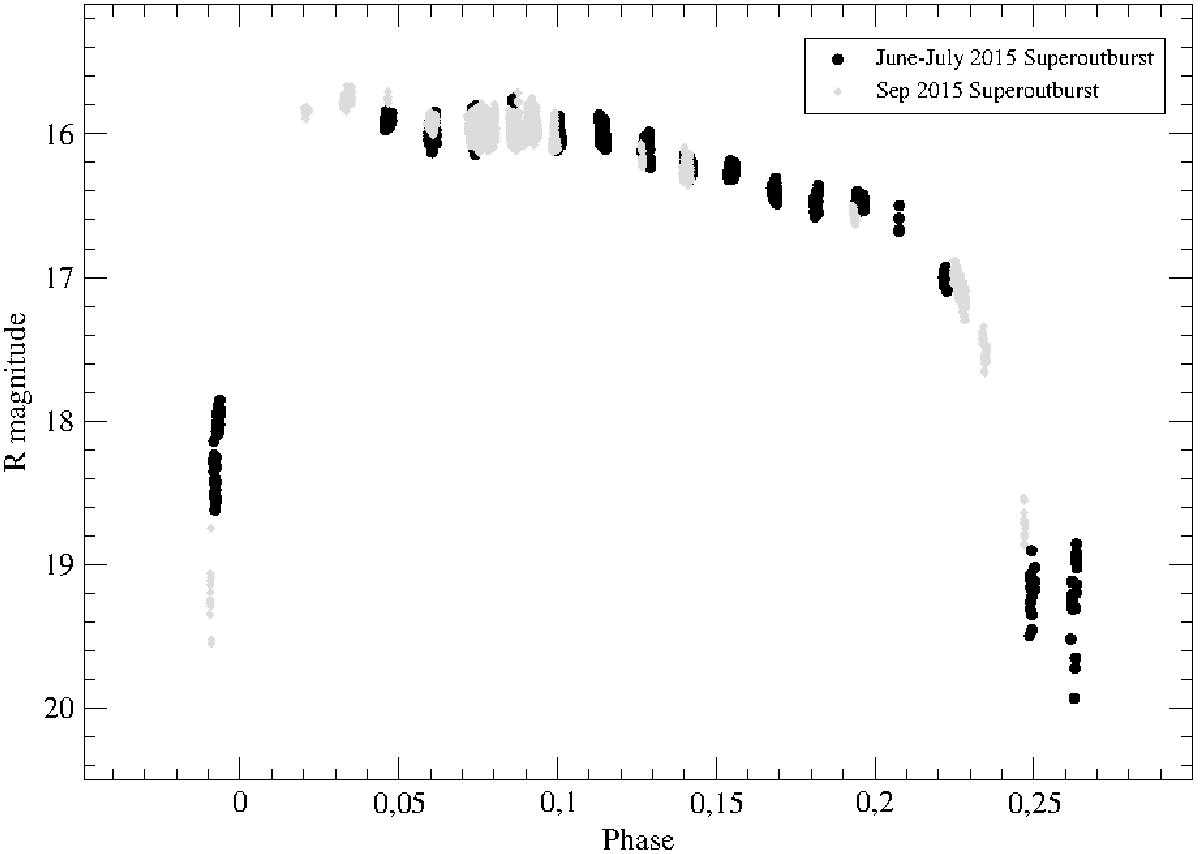
Light curve of MN Dra during superoutbursts folded with Psc = 74 days. Black circles correspond to the June–July 2015 superoutburst, and grey circles represent the September 2015 superoutburst.
Current usage metrics show cumulative count of Article Views (full-text article views including HTML views, PDF and ePub downloads, according to the available data) and Abstracts Views on Vision4Press platform.
Data correspond to usage on the plateform after 2015. The current usage metrics is available 48-96 hours after online publication and is updated daily on week days.
Initial download of the metrics may take a while.