Fig. 3
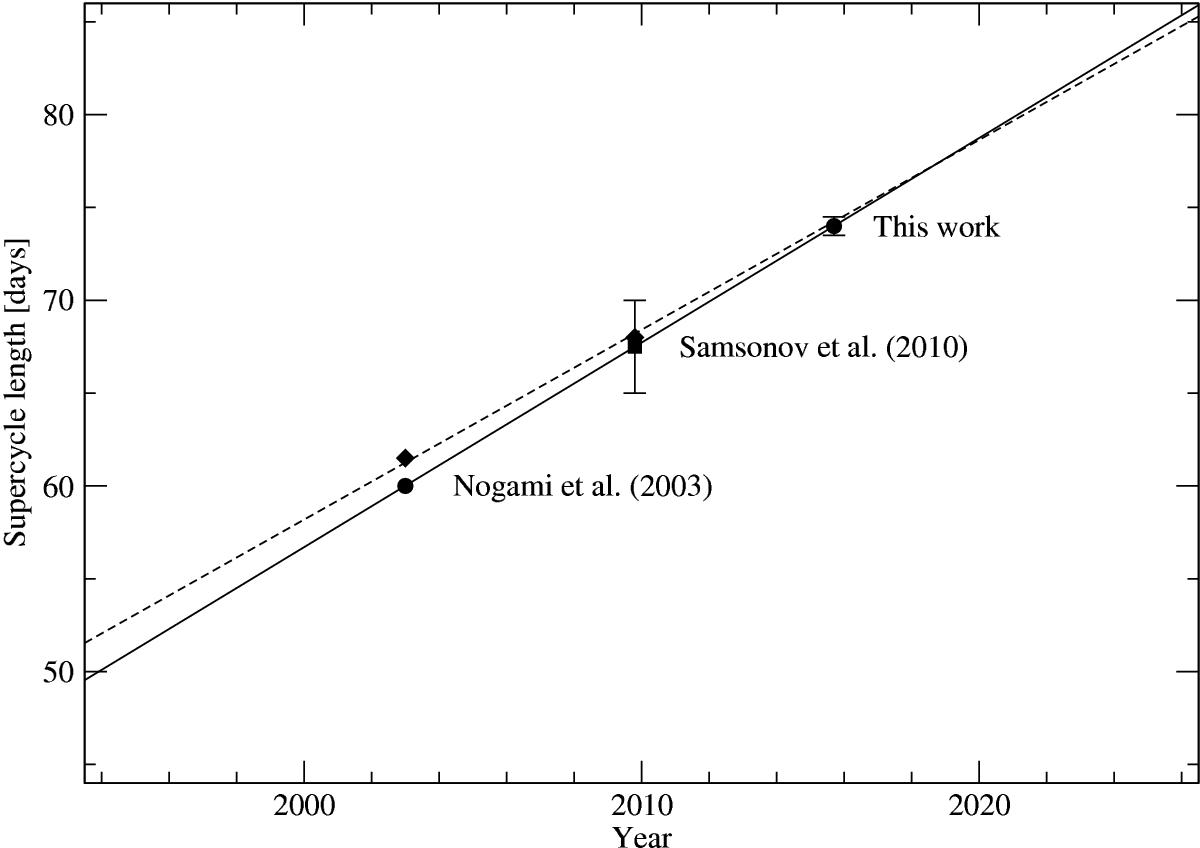
Increasing supercycle length of MN Dra during the past twelve years. Lines correspond to the best fits to the data (details in text). Uncertainties are given when available. The value of the supercycle length (Samsonov et al. 2010) was calculated by the authors of this work based on the light curves presented in Samsonov et al. (2010).
Current usage metrics show cumulative count of Article Views (full-text article views including HTML views, PDF and ePub downloads, according to the available data) and Abstracts Views on Vision4Press platform.
Data correspond to usage on the plateform after 2015. The current usage metrics is available 48-96 hours after online publication and is updated daily on week days.
Initial download of the metrics may take a while.