Fig. 14
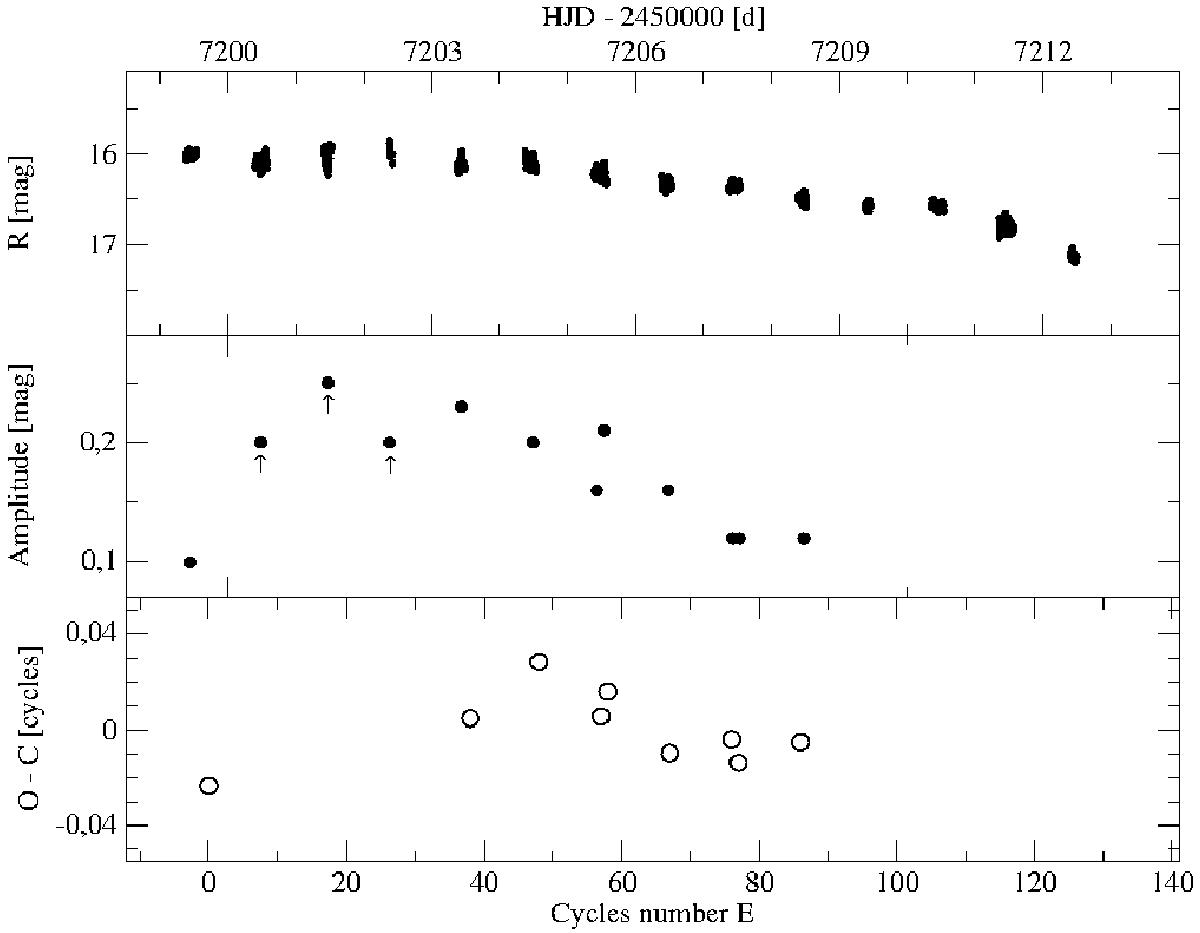
Light curves of MN Dra during the June–July 2015 superoutburst are shown in the top panel. The evolution of the amplitude of superhumps is presented in the middle panel. In three cases of scattered and/or incomplete data, the arrow marks a rough estimate of the amplitude, which is larger than the value indicated by a corresponding black circle. The O−C diagram for the superhumps maxima is in the bottom panel.
Current usage metrics show cumulative count of Article Views (full-text article views including HTML views, PDF and ePub downloads, according to the available data) and Abstracts Views on Vision4Press platform.
Data correspond to usage on the plateform after 2015. The current usage metrics is available 48-96 hours after online publication and is updated daily on week days.
Initial download of the metrics may take a while.