Fig. 9
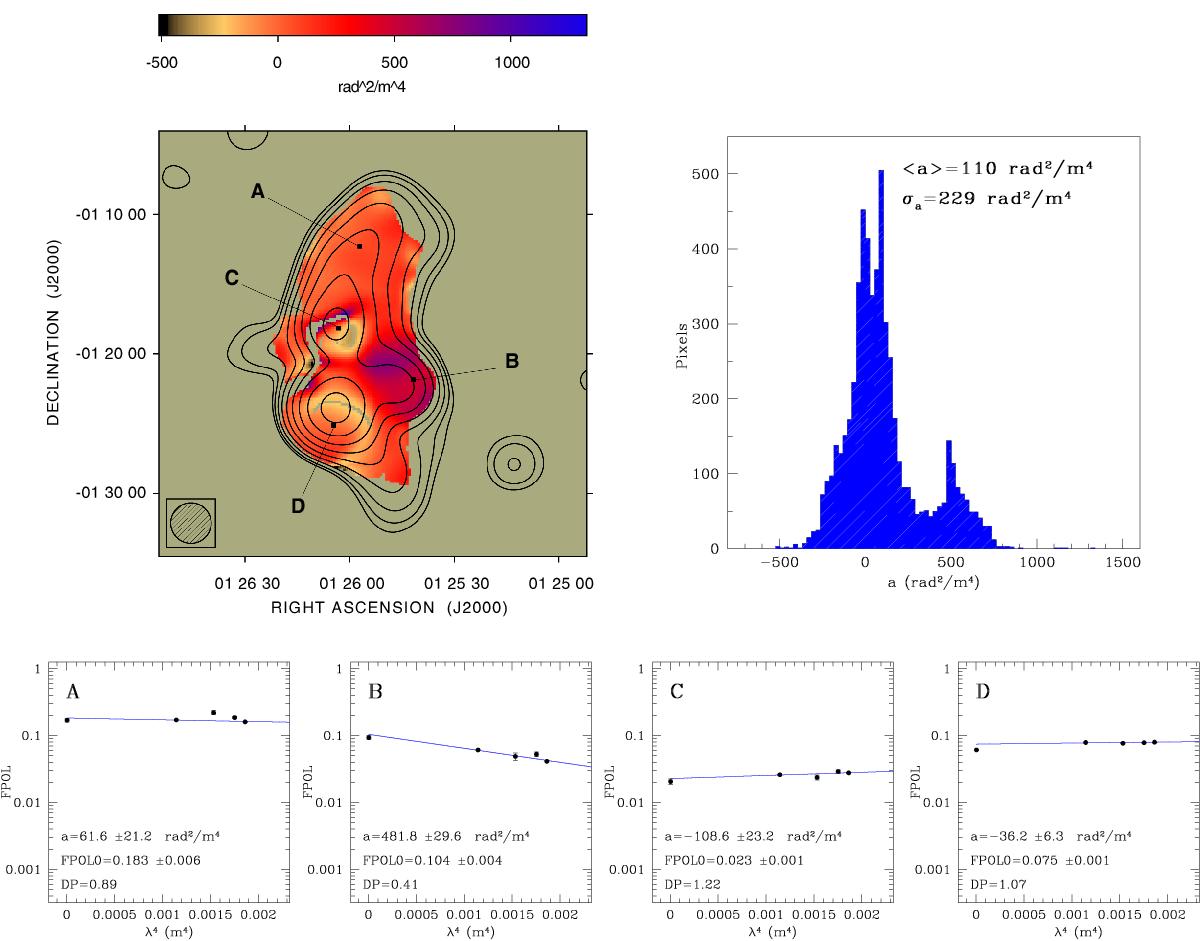
Top left: burn law a in rad2/m4 calculated using the images at 1443, 1465, 1515, 1630, and 6600 MHz smoothed with a FWHM Gaussian of 2.9′. The image is derived from a fit of FPOL as a function of λ4 following the Eq. (5). The color range is from −500 to 1300 rad2/m4. Contours refer to the total intensity image at 1443 MHz. The radio contours are drawn at 3σI and the rest are spaced by a factor of 2. Top right: histogram of the Burn law a distribution. Bottom: plots of fractional polarization FPOL as a function of λ4 at four different source locations.
Current usage metrics show cumulative count of Article Views (full-text article views including HTML views, PDF and ePub downloads, according to the available data) and Abstracts Views on Vision4Press platform.
Data correspond to usage on the plateform after 2015. The current usage metrics is available 48-96 hours after online publication and is updated daily on week days.
Initial download of the metrics may take a while.