Fig. 8
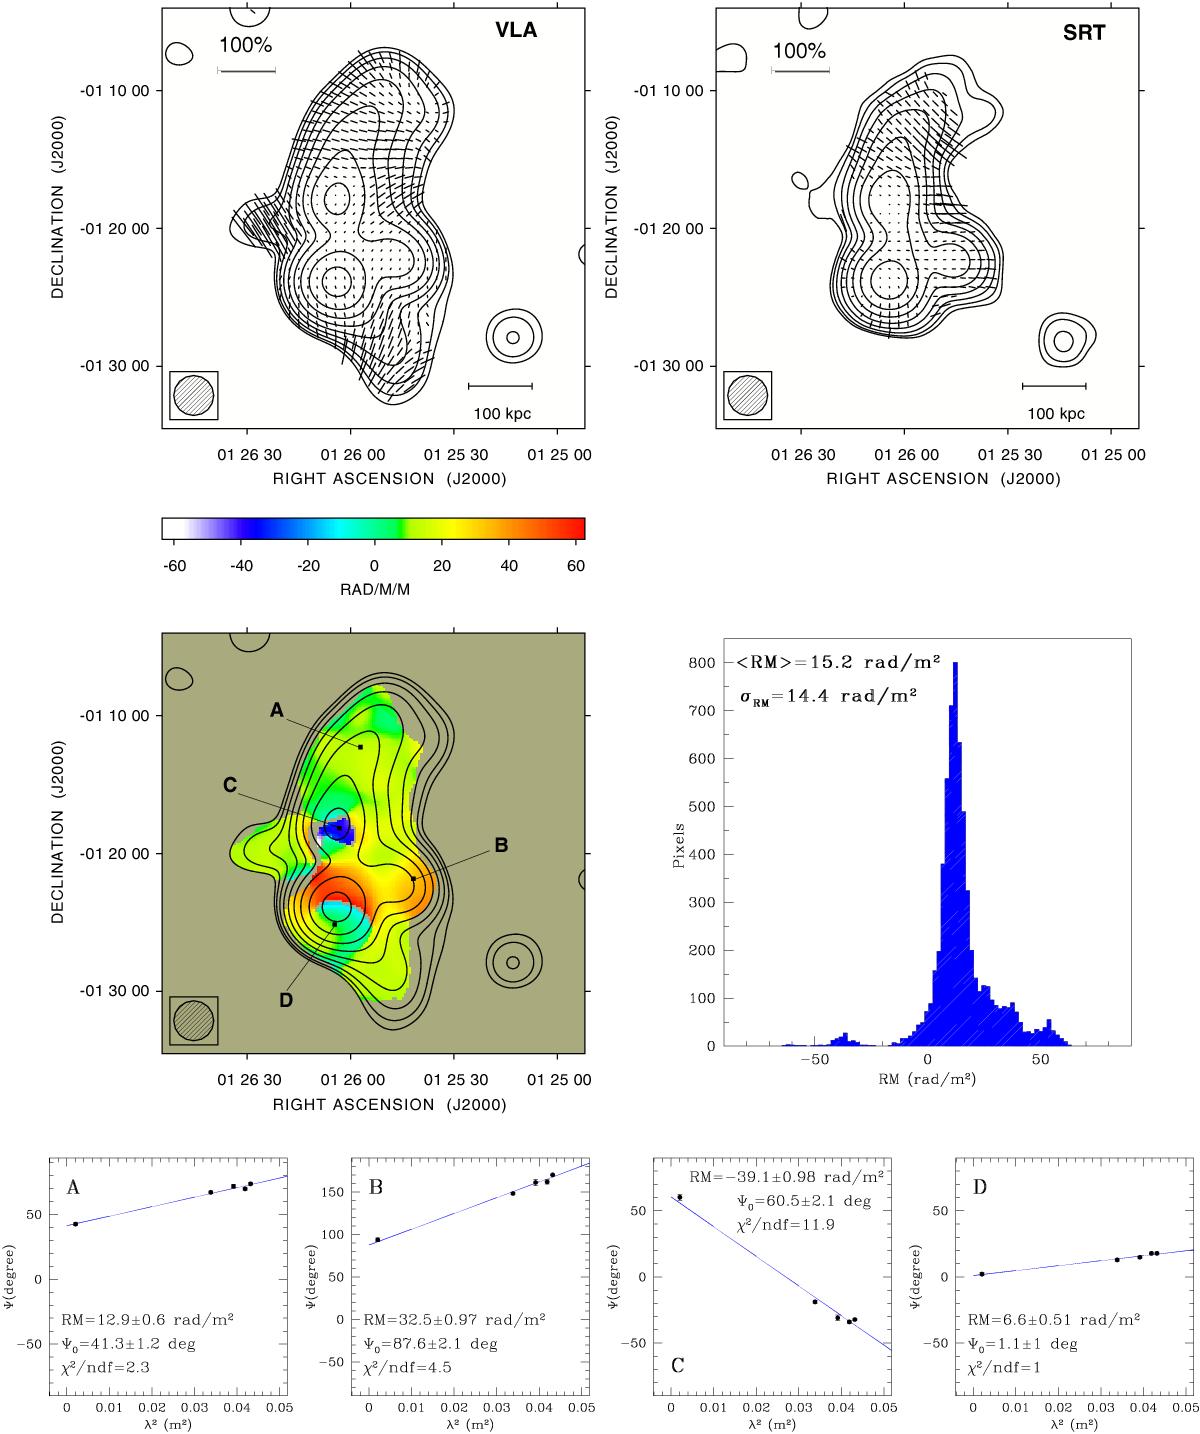
Top: total intensity contours and polarization vectors of the radio sources in Abell 194. VLA image (left) at 1443 MHz (σI = 2 mJy/beam), smoothed with a FWHM Gaussian of 2.9′. SRT image (right) at 6600 MHz (σI = 1 mJy/beam), with a resolution of 2.9′. The radio contours are drawn at 3σI and the rest are spaced by a factor of 2. The lines give the orientation of the electric vector position angle (E-field) and are proportional in length to the fractional polarization. The vectors are only traced for those pixels where the total intensity signal is above 5σI, the error on the polarization angle is less than 10°, and the fractional polarization is above 3σFPOL. Middle left: RM image calculated using the images at 1443, 1465, 1515, 1630, and 6600 MHz, smoothed with a FWHM Gaussian of 2.9′. The color range is from −60 to 60 rad/m2. Contours refer to the total intensity image at 1443 MHz as in the top left panel. Middle right: histogram of the RM distribution. Bottom: plots of the position angle Ψ as a function of λ2 at four different source locations.
Current usage metrics show cumulative count of Article Views (full-text article views including HTML views, PDF and ePub downloads, according to the available data) and Abstracts Views on Vision4Press platform.
Data correspond to usage on the plateform after 2015. The current usage metrics is available 48-96 hours after online publication and is updated daily on week days.
Initial download of the metrics may take a while.