Fig. 7
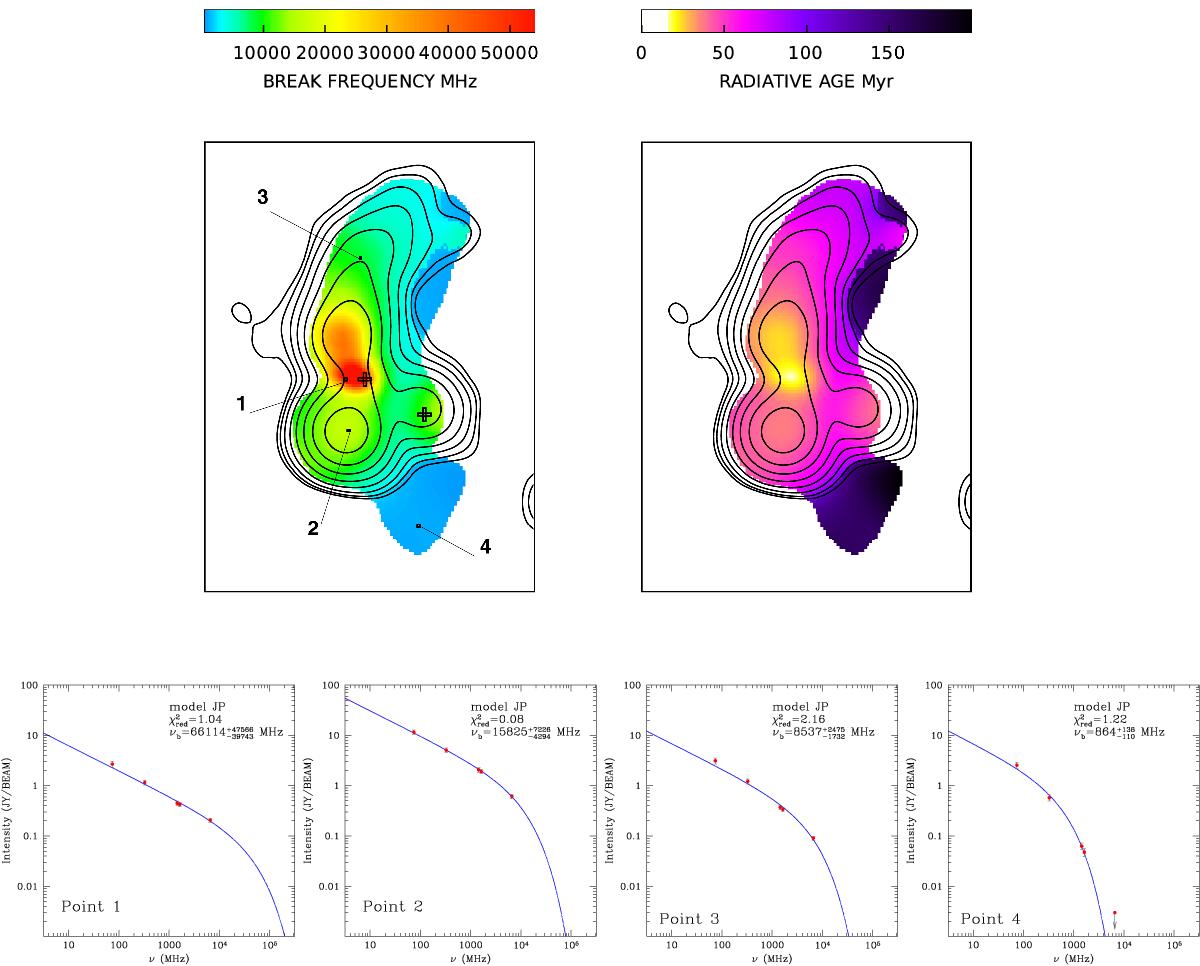
Top left: map of break frequency, smoothed to a resolution of 2.9′, and derived with the pixel by pixel fit of the JP model in the regions where the brightness of the VLSSr image is above 5σI. In the break frequency image there are about 15 independent beams. Contours refer to the SRT image at 6600 MHz. Crosses indicate the optical core of 3C 40 A and 3C 40 B. Top right: map of the radiative age, smoothed to a resolution of 2.9′, and derived in Eq. (2) by applying the break frequency image and minimum energy magnetic field. In the radiative age image there are about 15 independent beams. Contours refer to the SRT image at 6600 MHz. Bottom: plots of the radio surface brightness as a function of the observing frequency ν at different locations. The resulting fit of the JP model is shown as a blue line.
Current usage metrics show cumulative count of Article Views (full-text article views including HTML views, PDF and ePub downloads, according to the available data) and Abstracts Views on Vision4Press platform.
Data correspond to usage on the plateform after 2015. The current usage metrics is available 48-96 hours after online publication and is updated daily on week days.
Initial download of the metrics may take a while.