Fig. 6
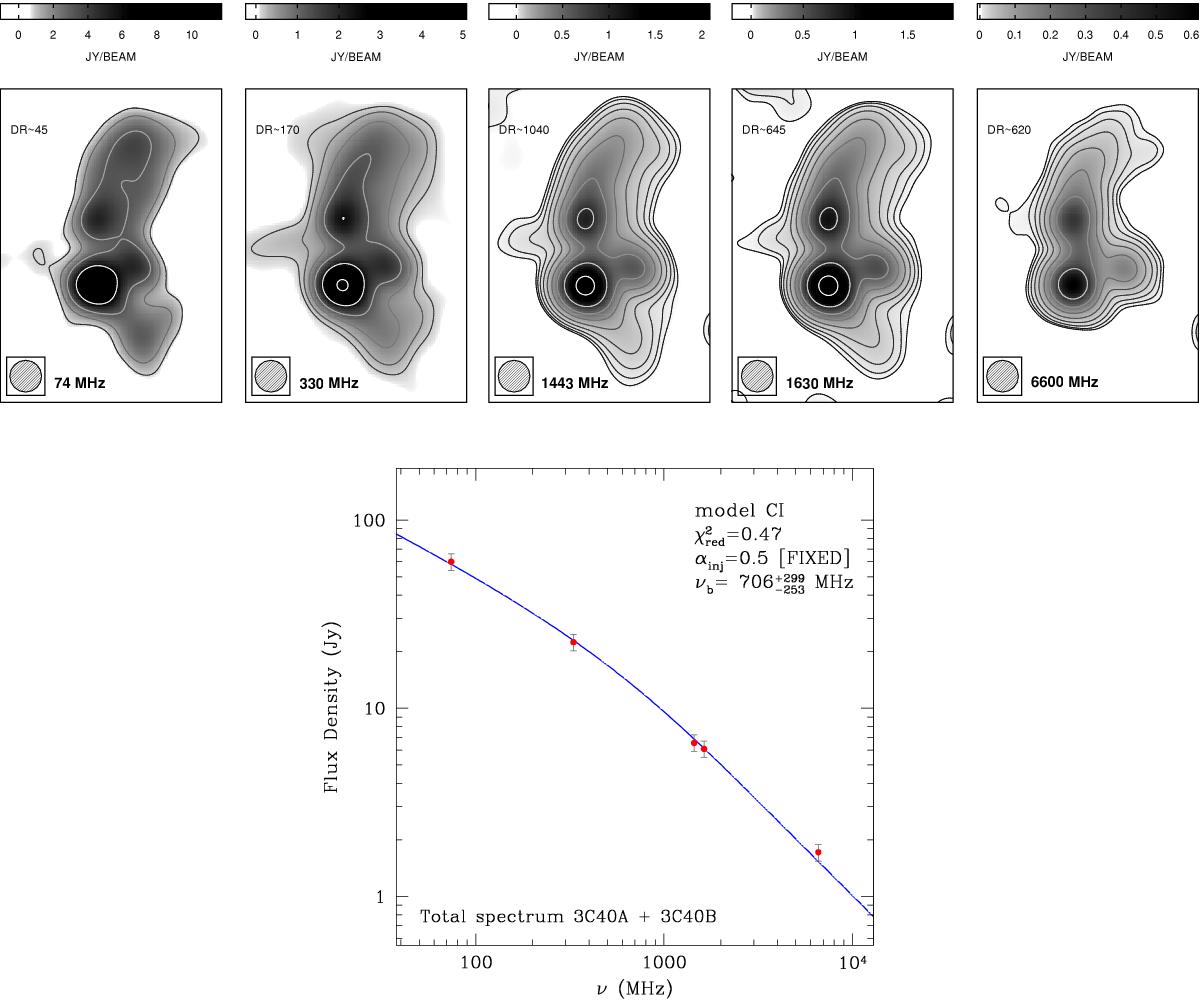
Top: images of 3C 40A and 3C 40B at different frequencies, smoothed to a resolution of 2.9′. The images are VLSSr (74 MHz; Lane et al. 2014), VLA P band (330 MHz), VLA L band (1443 and 1630 MHz), and SRT (6600 MHz). The dynamic range (DR) of each image is shown on each of the top panels. Bottom: total spectrum of sources 3C 40 A and 3C 40 B together. The blue line is the best fit of the CI model.
Current usage metrics show cumulative count of Article Views (full-text article views including HTML views, PDF and ePub downloads, according to the available data) and Abstracts Views on Vision4Press platform.
Data correspond to usage on the plateform after 2015. The current usage metrics is available 48-96 hours after online publication and is updated daily on week days.
Initial download of the metrics may take a while.