Fig. 14
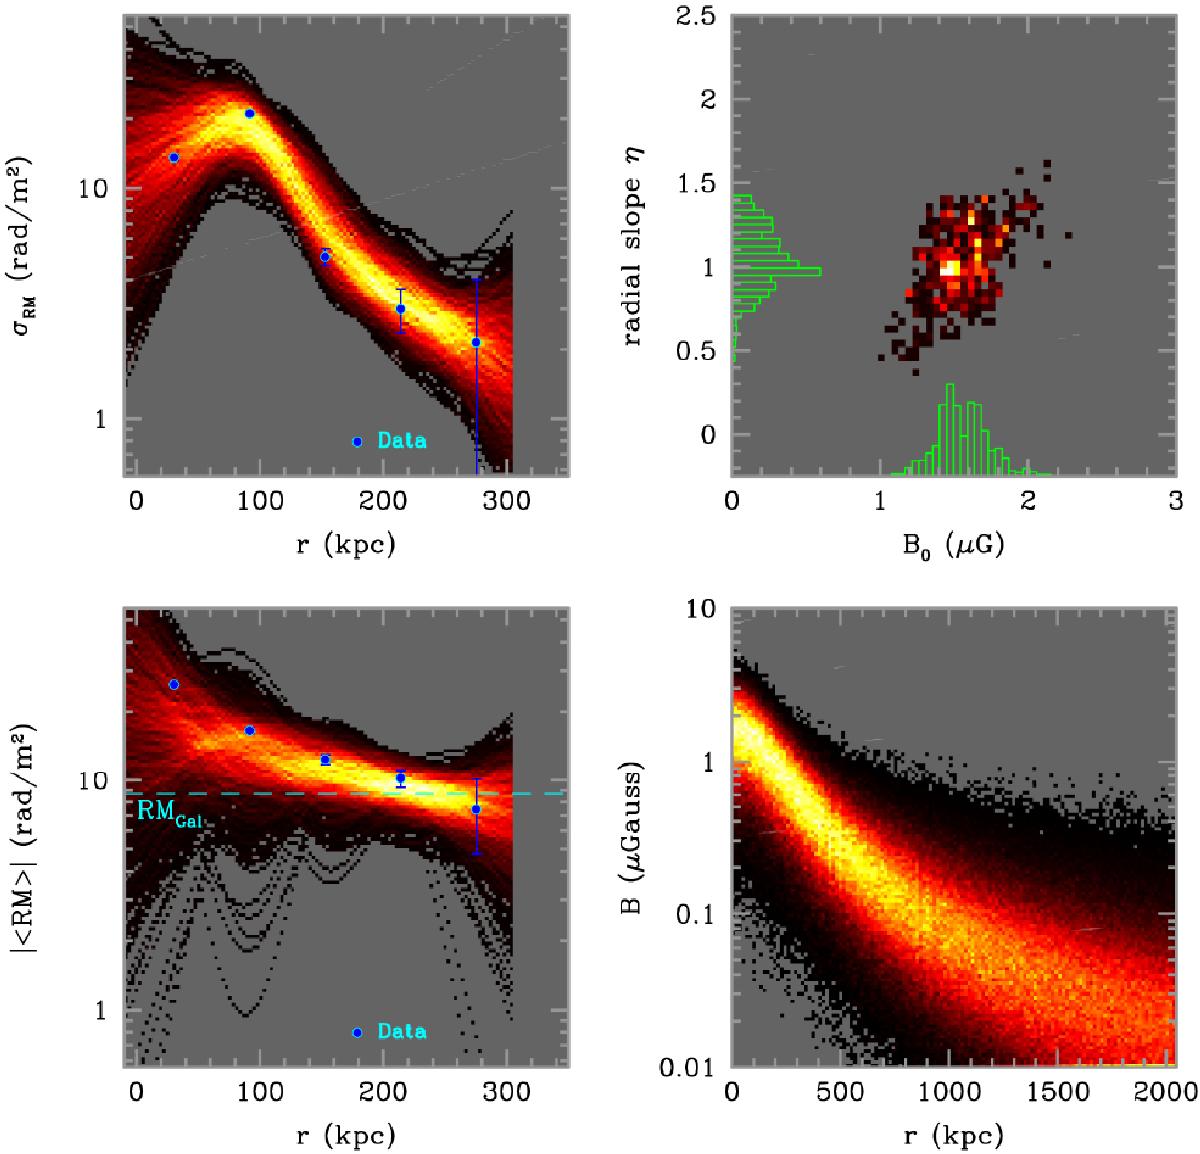
Bayesian three-dimensional analysis of the σRM and ⟨ RM ⟩ as a function of the distance from the cluster center. Top right panel: image of the posterior distribution of the model parameters along with one-dimensional marginalizations. Top left panel: dots represent the observed σRM profile as a function of the distance from the cluster center while the fan plot represents the population of synthetic σRM profile extracted from the posterior distribution of model parameters. Bottom left panel: dots represent the observed ⟨ RM ⟩ profile as a function of the distance from the cluster center while the fan plot represents the population of synthetic ⟨ RM ⟩ profile extracted from the posterior distribution of model parameters. The Galactic foreground of 8.7 rad/m2 (Oppermann et al. 2015) is indicated with a dashed line. Bottom right panel: trend of the mean magnetic field with the distance from the cluster center.
Current usage metrics show cumulative count of Article Views (full-text article views including HTML views, PDF and ePub downloads, according to the available data) and Abstracts Views on Vision4Press platform.
Data correspond to usage on the plateform after 2015. The current usage metrics is available 48-96 hours after online publication and is updated daily on week days.
Initial download of the metrics may take a while.