Fig. 13
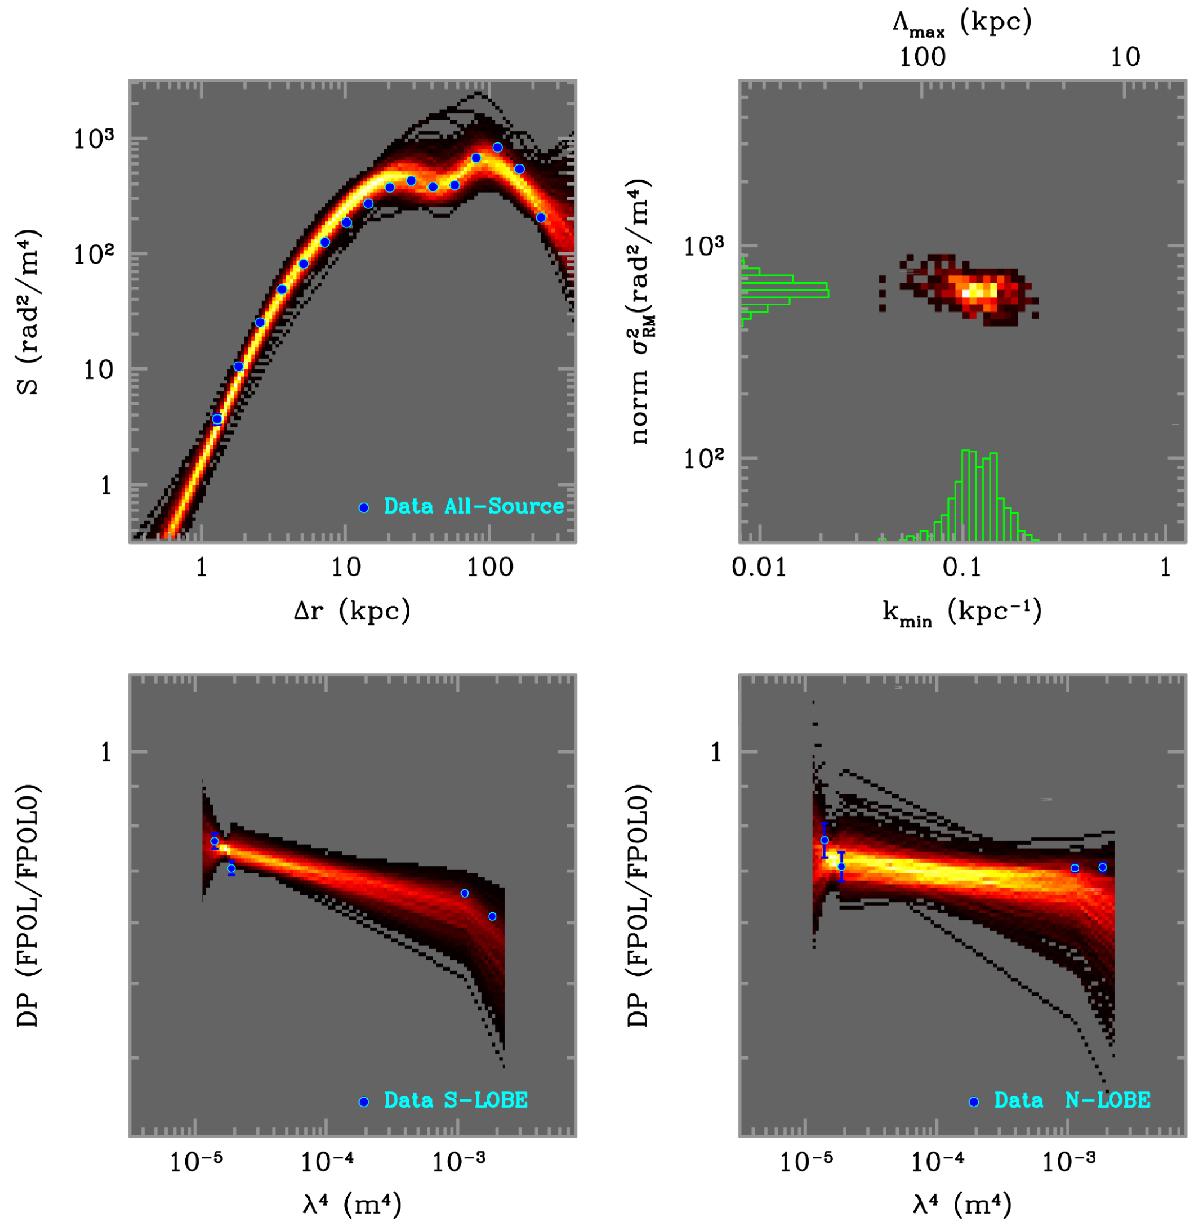
Bayesian two-dimensional analysis of the RM structure function S(Δr) and depolarization ratio FPOL/FPOL0(λ4). Top right panel: image of the posterior distribution of the model parameters along with one-dimensional marginalizations. Top left panel: dots represent the observed S(Δr) (error bars are comparable to the size of the symbols). The fan plot represents the population of synthetic RM structure functions from the posterior distribution. Bottom left panel: depolarization ratio as a function of λ4 for the southern lobe of 3C 40B. The dots represent the observed data while the fan plot represents the population of synthetic depolarization ratio extracted from the posterior distribution of model parameters. Bottom right panel: depolarization ratio as a function of λ4 for the northern lobe of 3C 40B.
Current usage metrics show cumulative count of Article Views (full-text article views including HTML views, PDF and ePub downloads, according to the available data) and Abstracts Views on Vision4Press platform.
Data correspond to usage on the plateform after 2015. The current usage metrics is available 48-96 hours after online publication and is updated daily on week days.
Initial download of the metrics may take a while.