Fig. 9
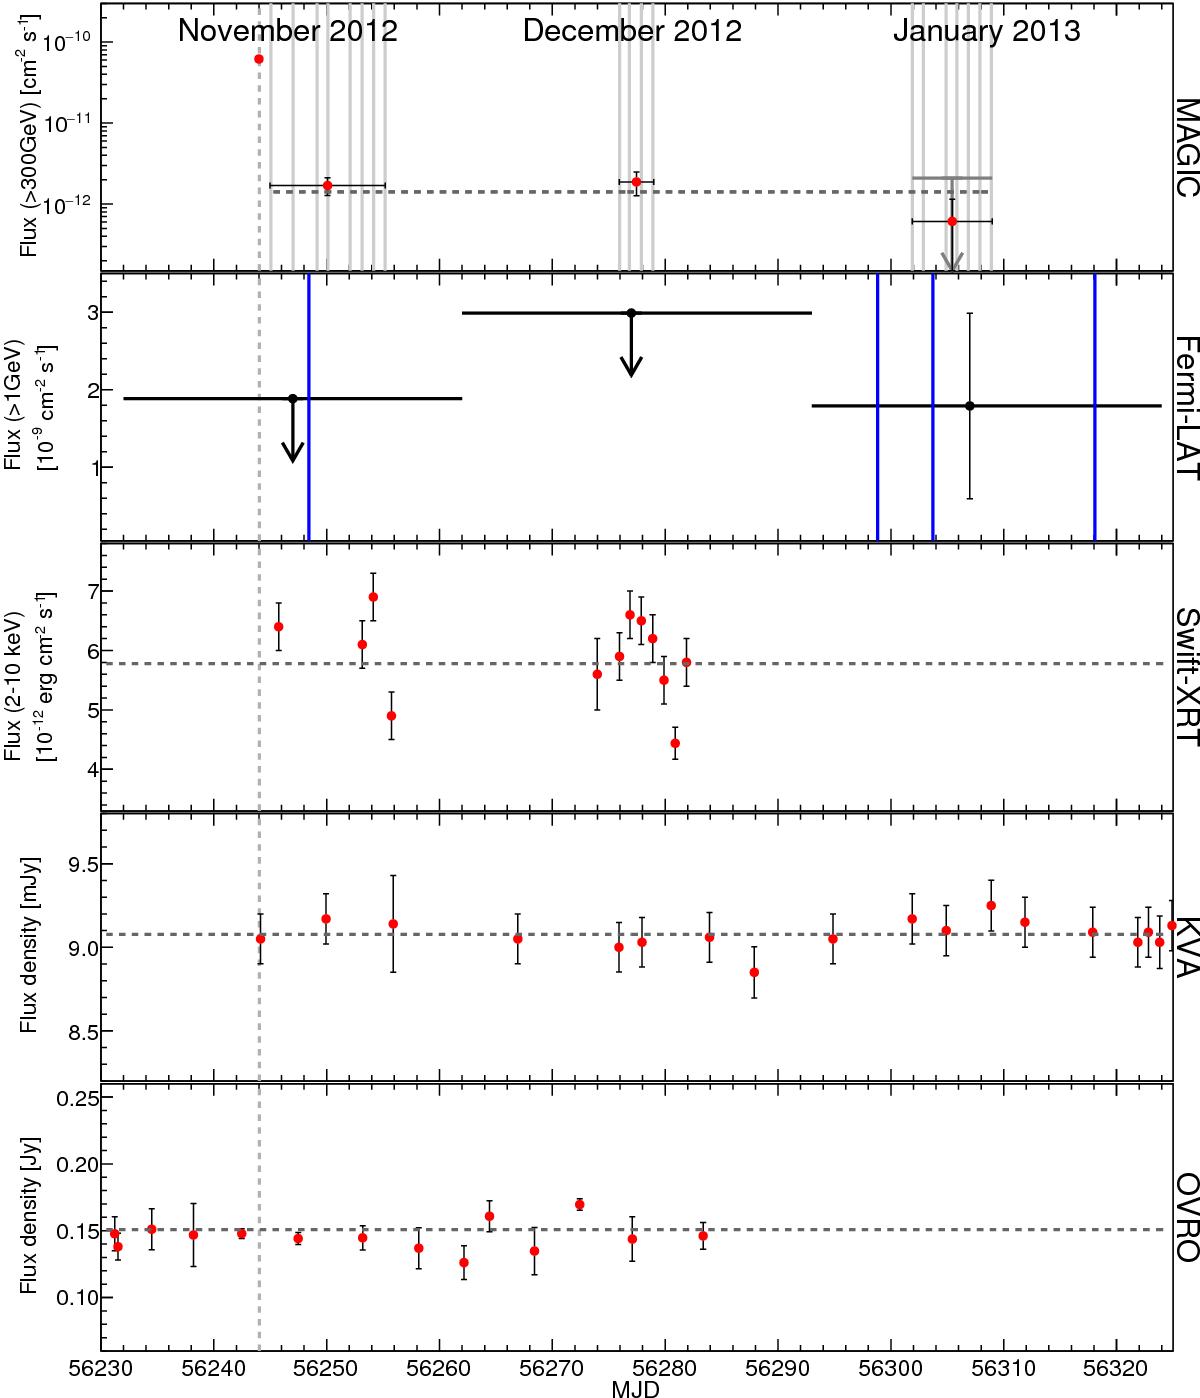
Multi-wavelength light curve of IC 310 between 2012 November and 2013 January. The vertical gray dashed line indicates the day of the TeV flare. The horizontal gray dashed lines are the fits to the data with a constant. From top to bottom: MAGIC monthly flux measurements above 300 GeV. In addition, for 2013 January a flux 95% confidence level upper limit is calculated. The gray lines indicate the individual days when observations were performed with MAGIC. We note that the y-axis uses a logarithmic scale. Fermi-LAT above 1 GeV, blue lines indicate the arrival times of gamma-ray event candidates. Swift-XRT fluxes between 2–10 keV. R-band flux measurements by KVA (not corrected for the contribution of the host galaxy). OVRO fluxes at 15 GHz.
Current usage metrics show cumulative count of Article Views (full-text article views including HTML views, PDF and ePub downloads, according to the available data) and Abstracts Views on Vision4Press platform.
Data correspond to usage on the plateform after 2015. The current usage metrics is available 48-96 hours after online publication and is updated daily on week days.
Initial download of the metrics may take a while.