Fig. 8
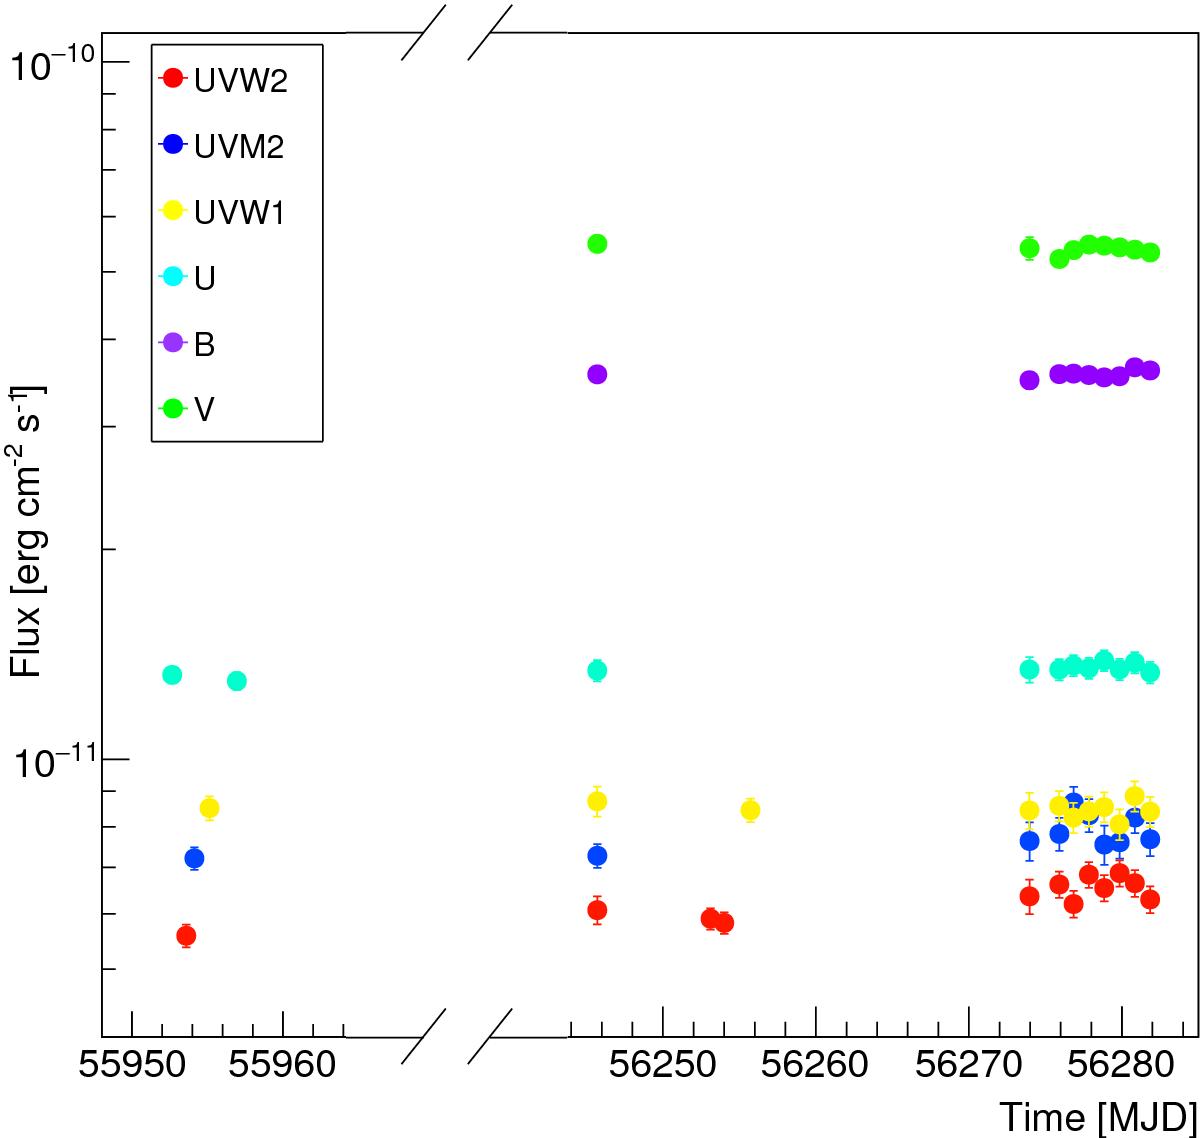
Multi-frequency energy flux light curve of IC 310 obtained from Swift-UVOT observations. The markers for the different frequencies are indicated in the legend. All data are de-reddened using NH = 0.13 × 1022 cm-2. To show the results from the 2012 January as well as the 2012 November to December observations simultaneously, the x-axis has been interrupted, as indicated by the diagonal lines. We note that the y-axis uses a logarithmic scale.
Current usage metrics show cumulative count of Article Views (full-text article views including HTML views, PDF and ePub downloads, according to the available data) and Abstracts Views on Vision4Press platform.
Data correspond to usage on the plateform after 2015. The current usage metrics is available 48-96 hours after online publication and is updated daily on week days.
Initial download of the metrics may take a while.