Fig. 7
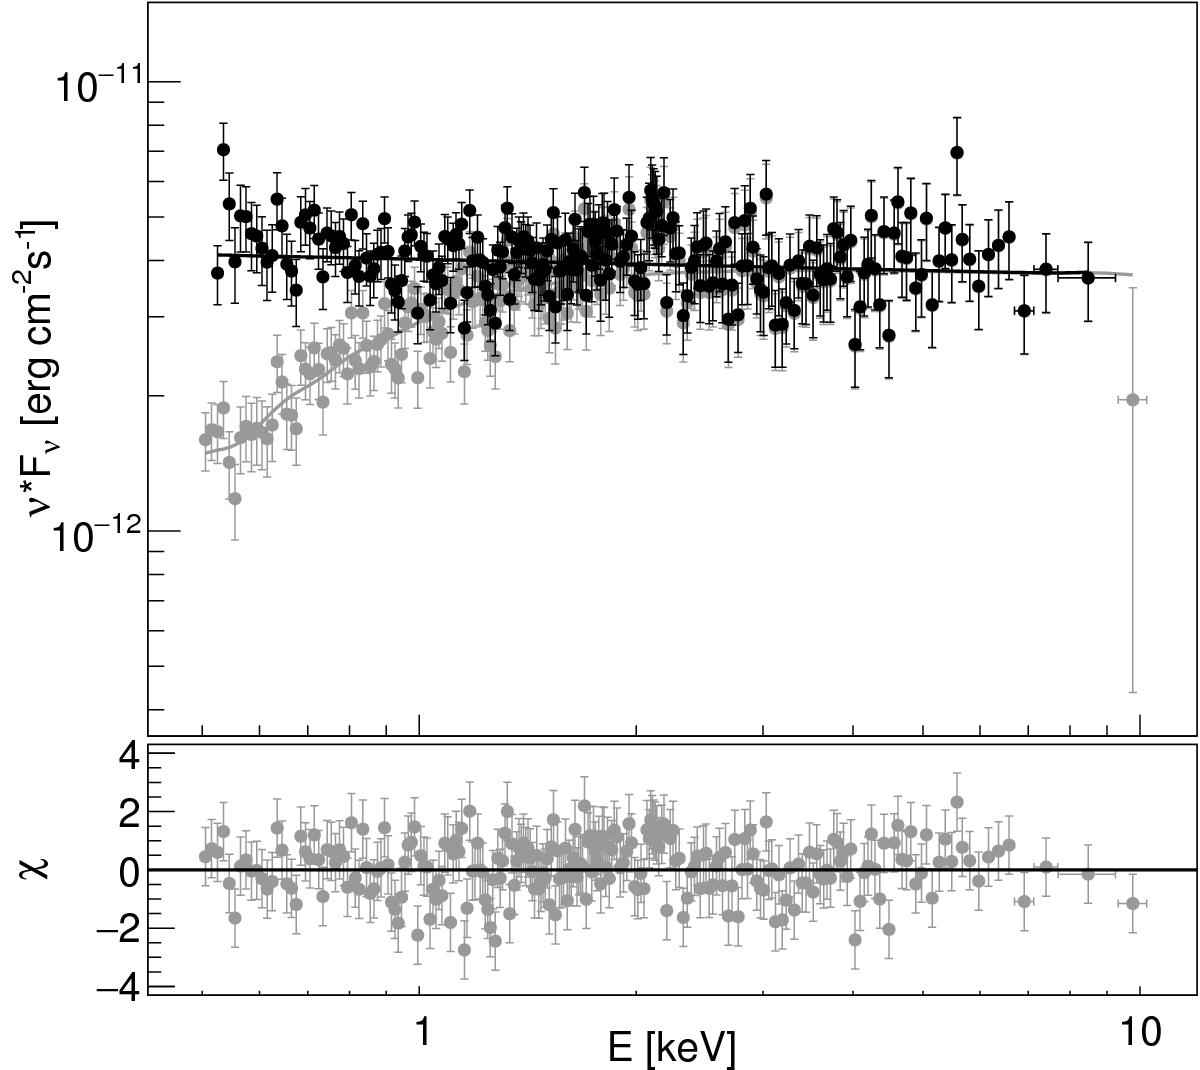
Averaged spectral energy distribution from Swift-XRT observations from 2012 November to December. The measured spectrum is shown with gray points and is fit with an absorbed power-law function (gray lines). Fit results are given in Table 4. The de-absorbed spectrum is shown with black points and black lines. Top panel: resulting spectra in the energy range 0.5–10 keV. Bottom panel: residual of the observed spectrum.
Current usage metrics show cumulative count of Article Views (full-text article views including HTML views, PDF and ePub downloads, according to the available data) and Abstracts Views on Vision4Press platform.
Data correspond to usage on the plateform after 2015. The current usage metrics is available 48-96 hours after online publication and is updated daily on week days.
Initial download of the metrics may take a while.