Fig. 6
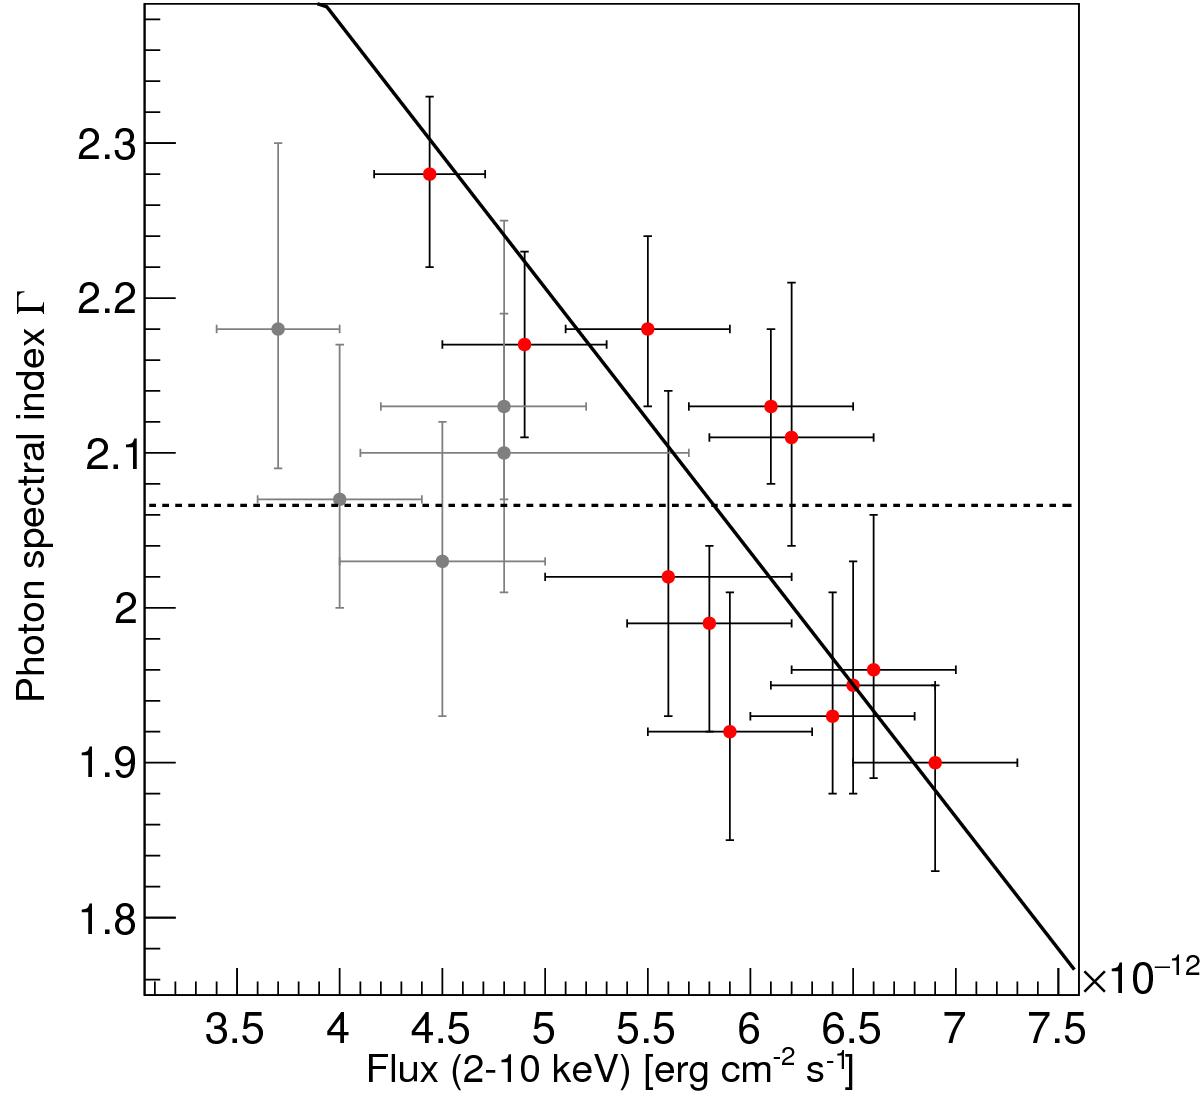
Power-law index of X-ray spectra as a function of the energy flux (2–10 keV) measured by Swift-XRT. The dashed and solid lines represent a fit to the data with a constant and a linear function, respectively. Red points show the results from individual pointing during the MWL campaign. Additionally, gray points represent the 2012 January data.
Current usage metrics show cumulative count of Article Views (full-text article views including HTML views, PDF and ePub downloads, according to the available data) and Abstracts Views on Vision4Press platform.
Data correspond to usage on the plateform after 2015. The current usage metrics is available 48-96 hours after online publication and is updated daily on week days.
Initial download of the metrics may take a while.