Fig. 2
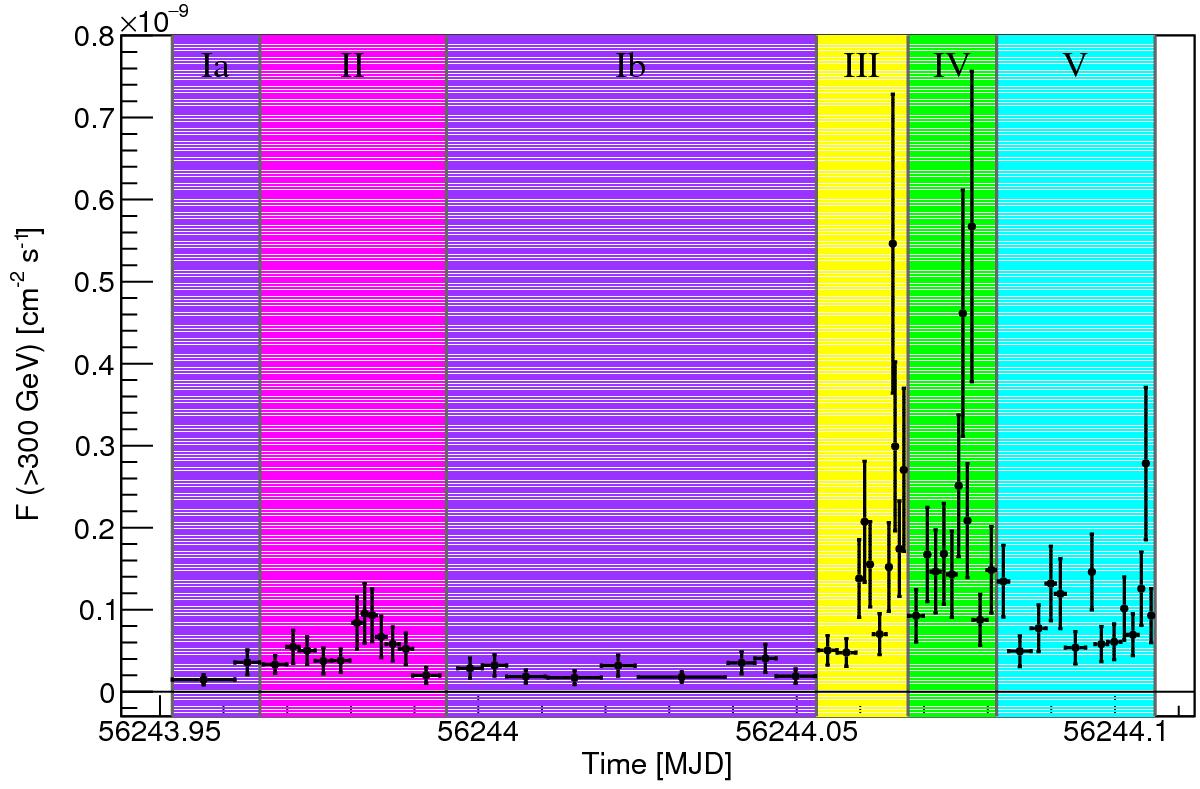
Division of the MAGIC data taken during the night of 2012 November 12–13 into data sub-sets according to different flux states. The light curve data points are taken from Aleksić et al. (2014c). Vertical lines and colored boxes indicate the boundaries for the different flux periods used for the investigation of the spectral variability. The time intervals related to the above-mentioned periods are reported in Table 1.
Current usage metrics show cumulative count of Article Views (full-text article views including HTML views, PDF and ePub downloads, according to the available data) and Abstracts Views on Vision4Press platform.
Data correspond to usage on the plateform after 2015. The current usage metrics is available 48-96 hours after online publication and is updated daily on week days.
Initial download of the metrics may take a while.