Fig. 10
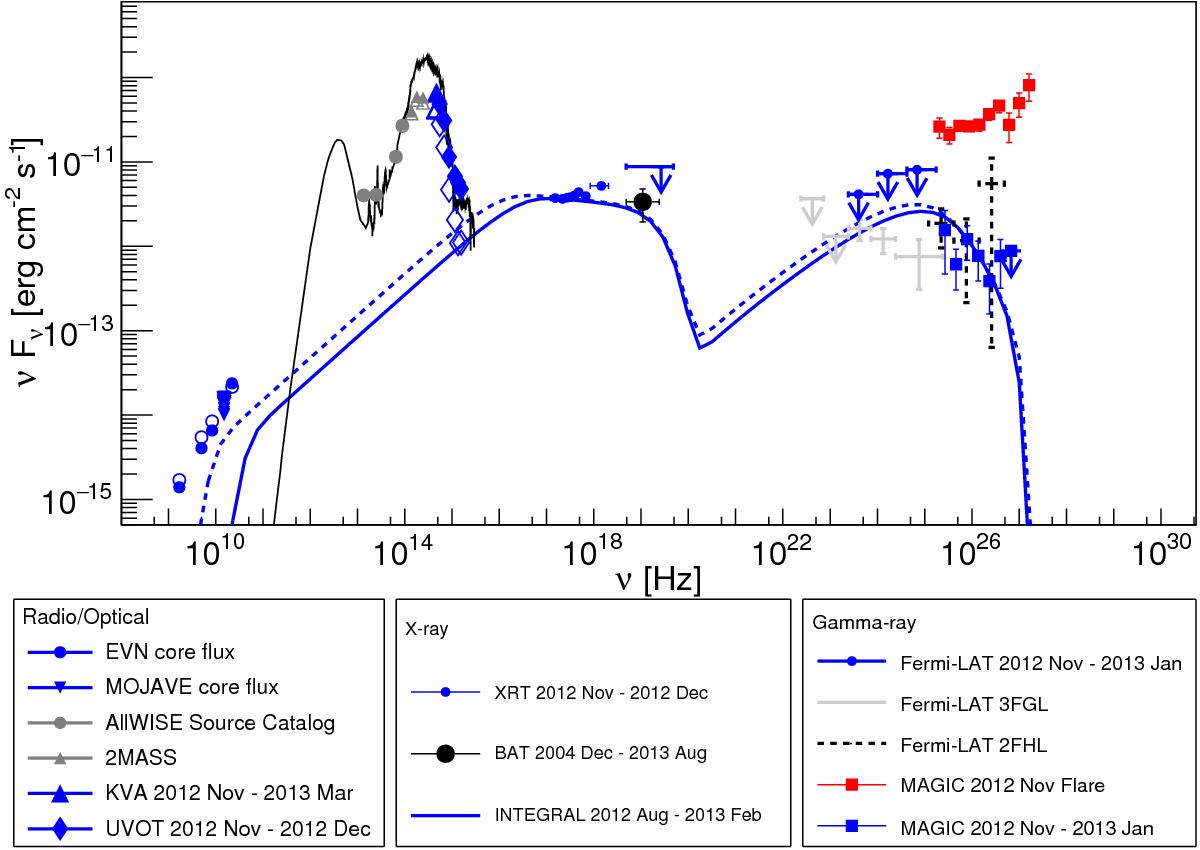
Contemporaneous broadband spectral energy distribution during the MWL campaign from 2012 November to 2013 January (blue points). Individual data points are explained in the legends. Long-term averaged (if they outlast the campaign) and archival measurements are shown in black and gray, respectively. The MAGIC data points were de-absorbed using the EBL model by Domínguez et al. (2011). The red points show the derived SED of the flare observed at the beginning of the campaign, and reported in Aleksić et al. (2014c). The Fermi-LAT upper limits were calculated for the time period 2012 November to 2013 January. In addition, the data points from the 3FGL (Acero et al. 2015) and 2FHL catalogs (Ackermann et al. 2016) are shown. The XRT data were averaged over the entire campaign, de-absorbed with an equivalent column of hydrogen and re-binned to eight points. The data from 2MASS, AllWISE, KVA, and UVOT (open markers) have been de-reddened (filled markers) according to the XRT data. The open markers in the radio band indicate the measured total flux density, whereas the filled markers are the core flux density values. The 5.0 GHz measurement is taken from Aleksić et al. (2014c). The blue lines were obtained from a modeling of the data with a single-zone SSC model from Krawczynski et al. (2004). The solid and dashed lines are the model with a viewing angle of 10° and 20°, respectively. The black line represents a template SED for an S0 host galaxy from Polletta et al. (2007).
Current usage metrics show cumulative count of Article Views (full-text article views including HTML views, PDF and ePub downloads, according to the available data) and Abstracts Views on Vision4Press platform.
Data correspond to usage on the plateform after 2015. The current usage metrics is available 48-96 hours after online publication and is updated daily on week days.
Initial download of the metrics may take a while.