Fig. 1
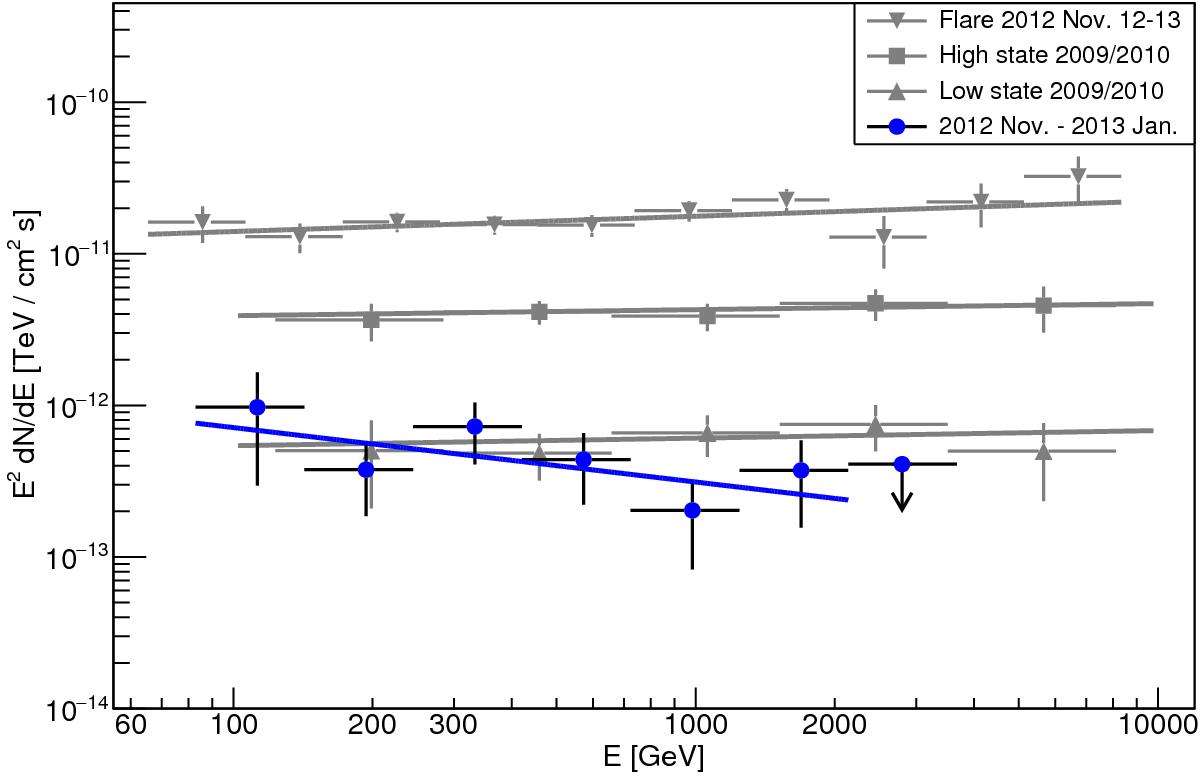
Measured spectra in the VHE band during different flux states obtained with MAGIC. The blue data points as well as the blue line show the resulting spectra from observations during 2012 November and 2013 January (excluding the large VHE flare from 2012 Nov. 12–13). Spectral results from previous publications (Aleksić et al. 2014a,c) are shown in gray for comparison.
Current usage metrics show cumulative count of Article Views (full-text article views including HTML views, PDF and ePub downloads, according to the available data) and Abstracts Views on Vision4Press platform.
Data correspond to usage on the plateform after 2015. The current usage metrics is available 48-96 hours after online publication and is updated daily on week days.
Initial download of the metrics may take a while.