Fig. 9
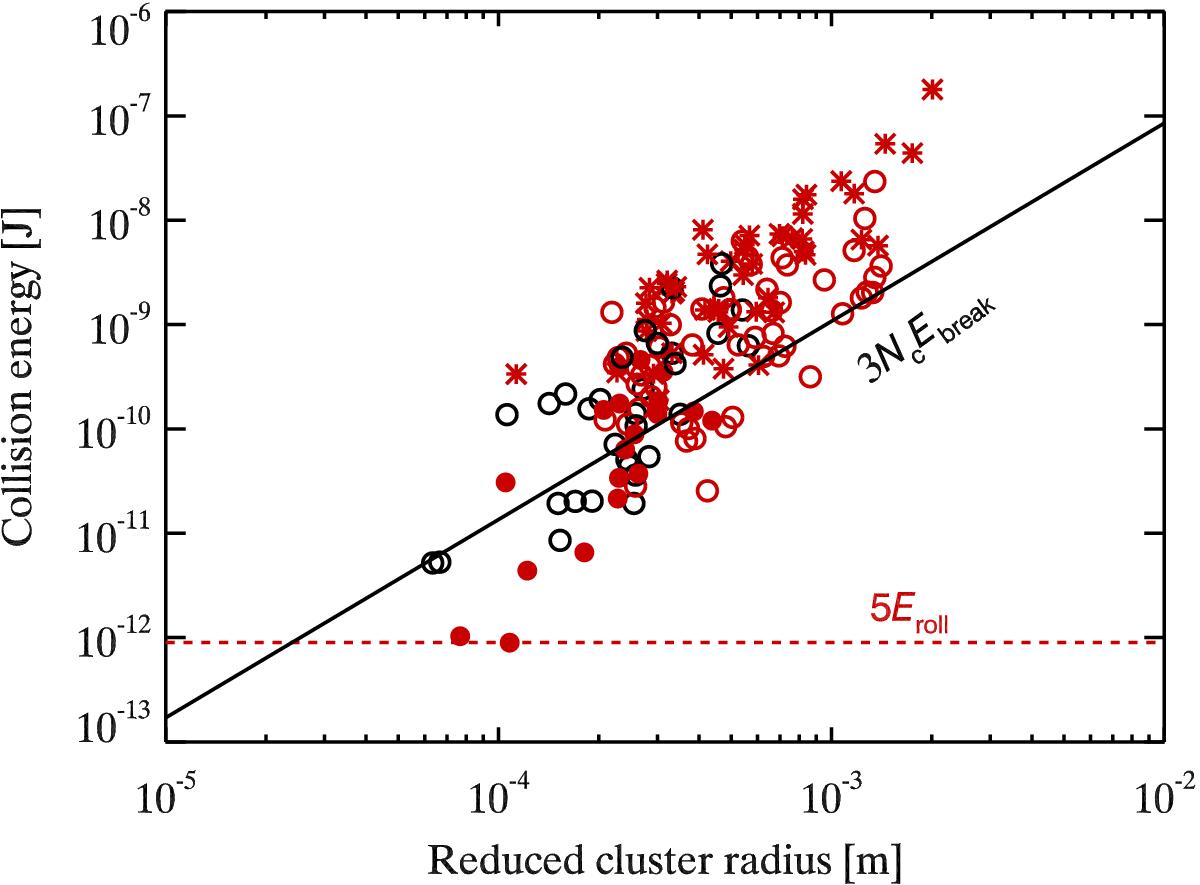
Cluster collisions, including collisions with the experiment cell walls for the M sample. Filled circles indicate sticking, open circles indicate bouncing, and asterisks indicate fragmentation. Red points show the collisions that displayed visible restructuring. The threshold energies 5Eroll for onset of visible restructuring (red dashed line) and 3NcEbreak for the loss of the first monomers (solid) are represented.
Current usage metrics show cumulative count of Article Views (full-text article views including HTML views, PDF and ePub downloads, according to the available data) and Abstracts Views on Vision4Press platform.
Data correspond to usage on the plateform after 2015. The current usage metrics is available 48-96 hours after online publication and is updated daily on week days.
Initial download of the metrics may take a while.