Fig. 8
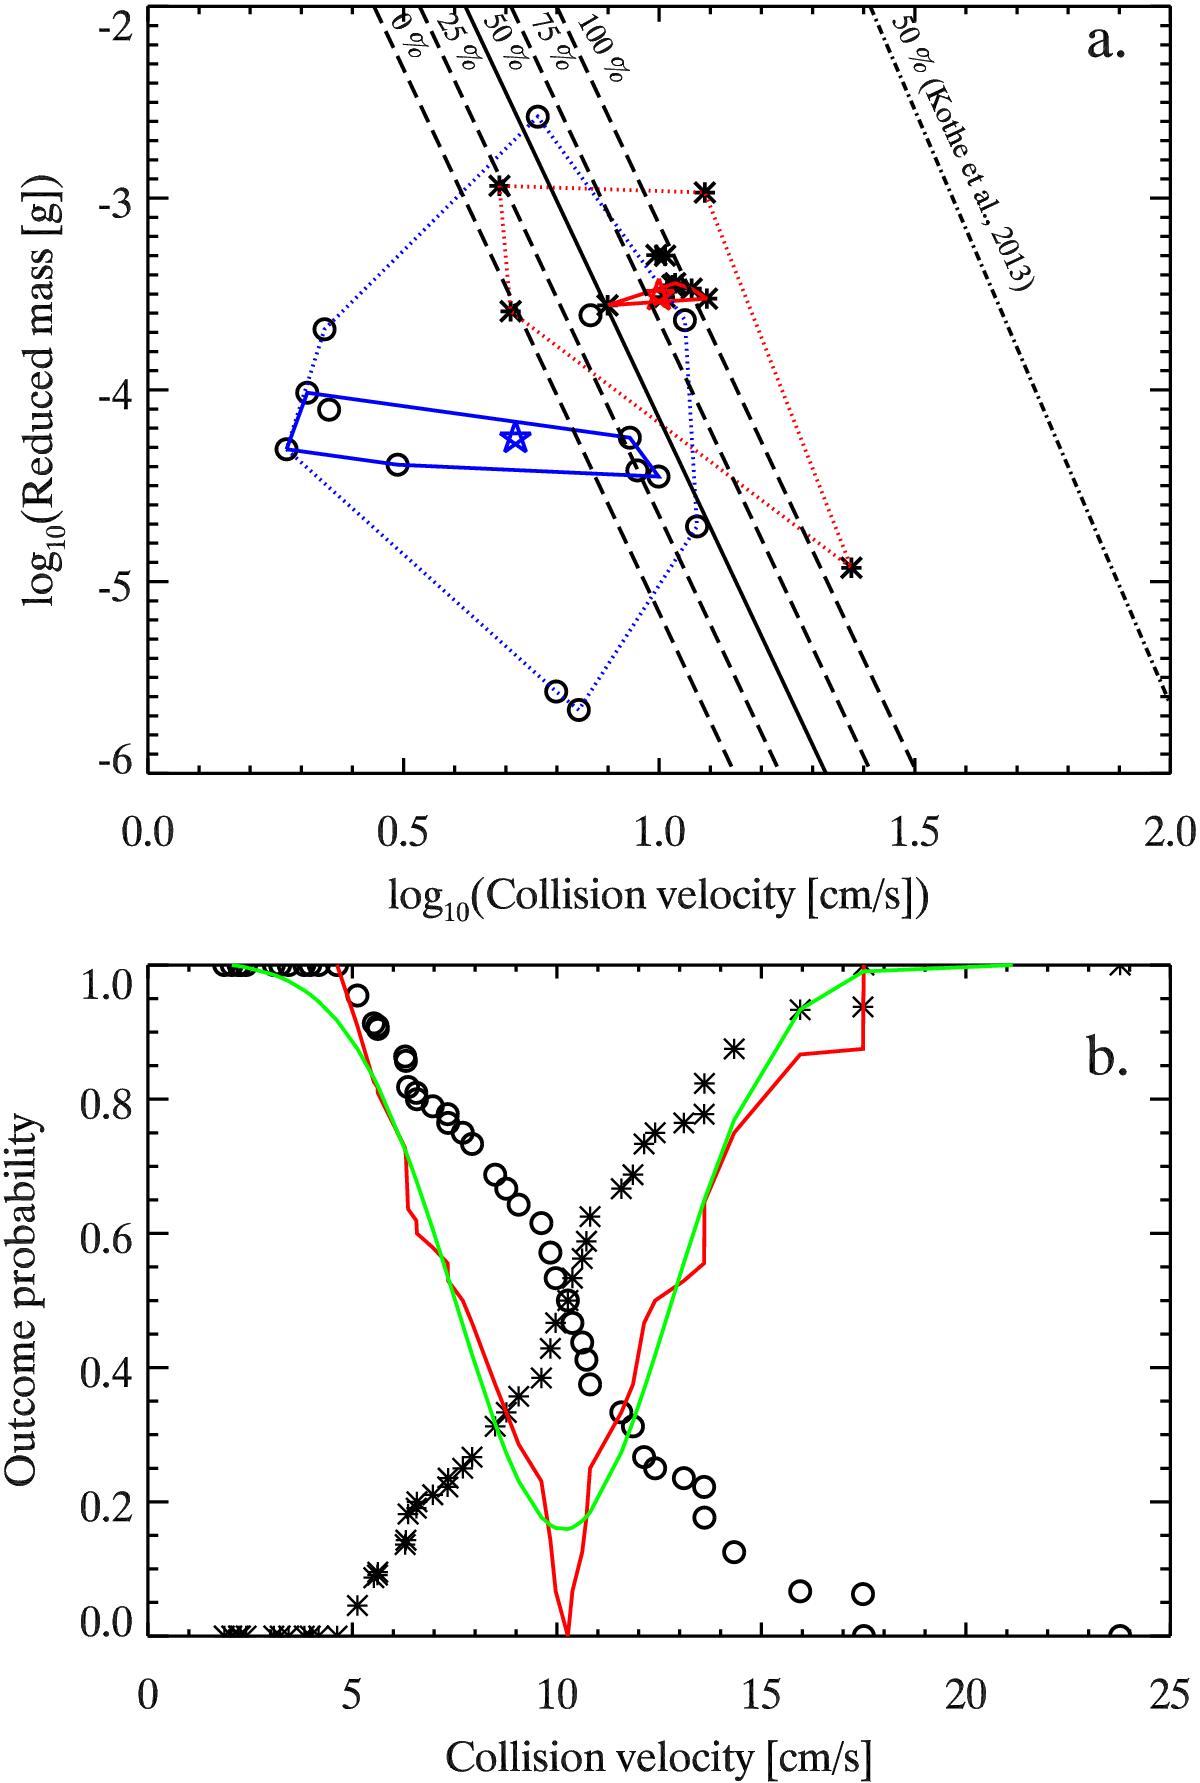
Panel a): transition between bouncing (circles, blue) and fragmentation (asterisks, red) for M clusters. The mean of each set of data points are denoted by the stars. The solid contours enclose half of the respective data points around their mean value (50% occurrence) and the dotted contours enclose all of the data points (100% occurrence). The solid black line indicates the computed 50% transition between bouncing and fragmentation, and the dashed lines the corresponding 0, 25, 75, and 100% probability for fragmentation (derived from the bouncing and fragmentation probabilities shown in b). The dash-dotted line on the right side of the plot represents the fragmentation onset in the collision model of Kothe et al. (2013). Panel b): bouncing (open circles) and fragmentation (asterisks) probabilities for collisions between clusters composed of aggregates of monodisperse dust. The red curve shows the difference in outcome probability and the green curve shows its Gaussian fit. This probability difference was used to compute the 0, 25, 75, and 100% probability levels shown as dashed lines in a). (see details in text).
Current usage metrics show cumulative count of Article Views (full-text article views including HTML views, PDF and ePub downloads, according to the available data) and Abstracts Views on Vision4Press platform.
Data correspond to usage on the plateform after 2015. The current usage metrics is available 48-96 hours after online publication and is updated daily on week days.
Initial download of the metrics may take a while.