Fig. 4
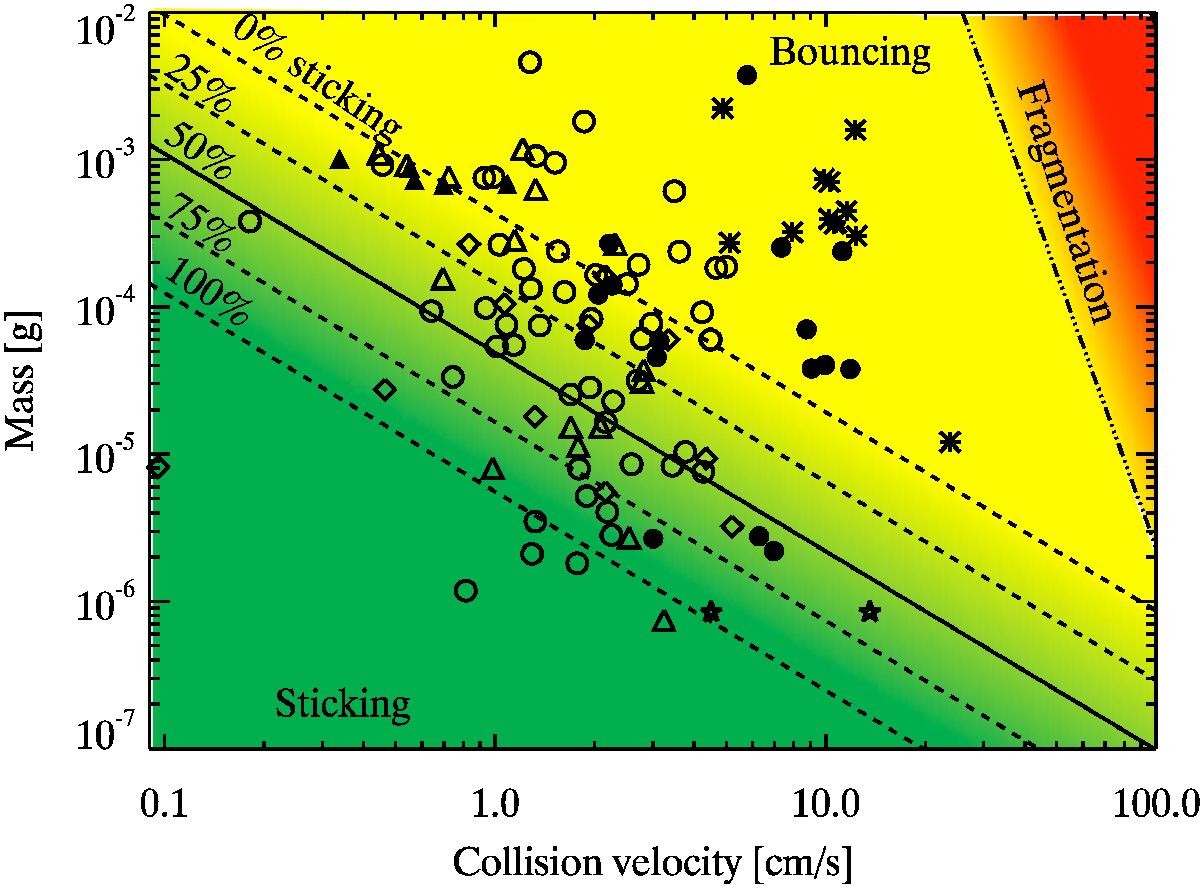
Aggregate collision outcomes observed. Open symbols indicate sticking, filled symbols indicate bouncing, and asterisks indicate fragmentation (M only). Circles denote the M sample, diamonds refer to the CM sample, triangles denote the SP sample, and stars denote the data points deduced from non-agglomerating IP. The background colours correspond to the dust collision model developed by Güttler et al. (2010). Green indicates sticking, yellow indicates bouncing, and red indicates fragmentation. The lines represent the limits between sticking and bouncing (solid line for a 50% sticking probability and dashed lines for 0, 25, 75, and 100% probabilities) and bouncing and fragmentation (dash-dotted line for the onset of fragmentation), which were computed by Kothe et al. (2013).
Current usage metrics show cumulative count of Article Views (full-text article views including HTML views, PDF and ePub downloads, according to the available data) and Abstracts Views on Vision4Press platform.
Data correspond to usage on the plateform after 2015. The current usage metrics is available 48-96 hours after online publication and is updated daily on week days.
Initial download of the metrics may take a while.