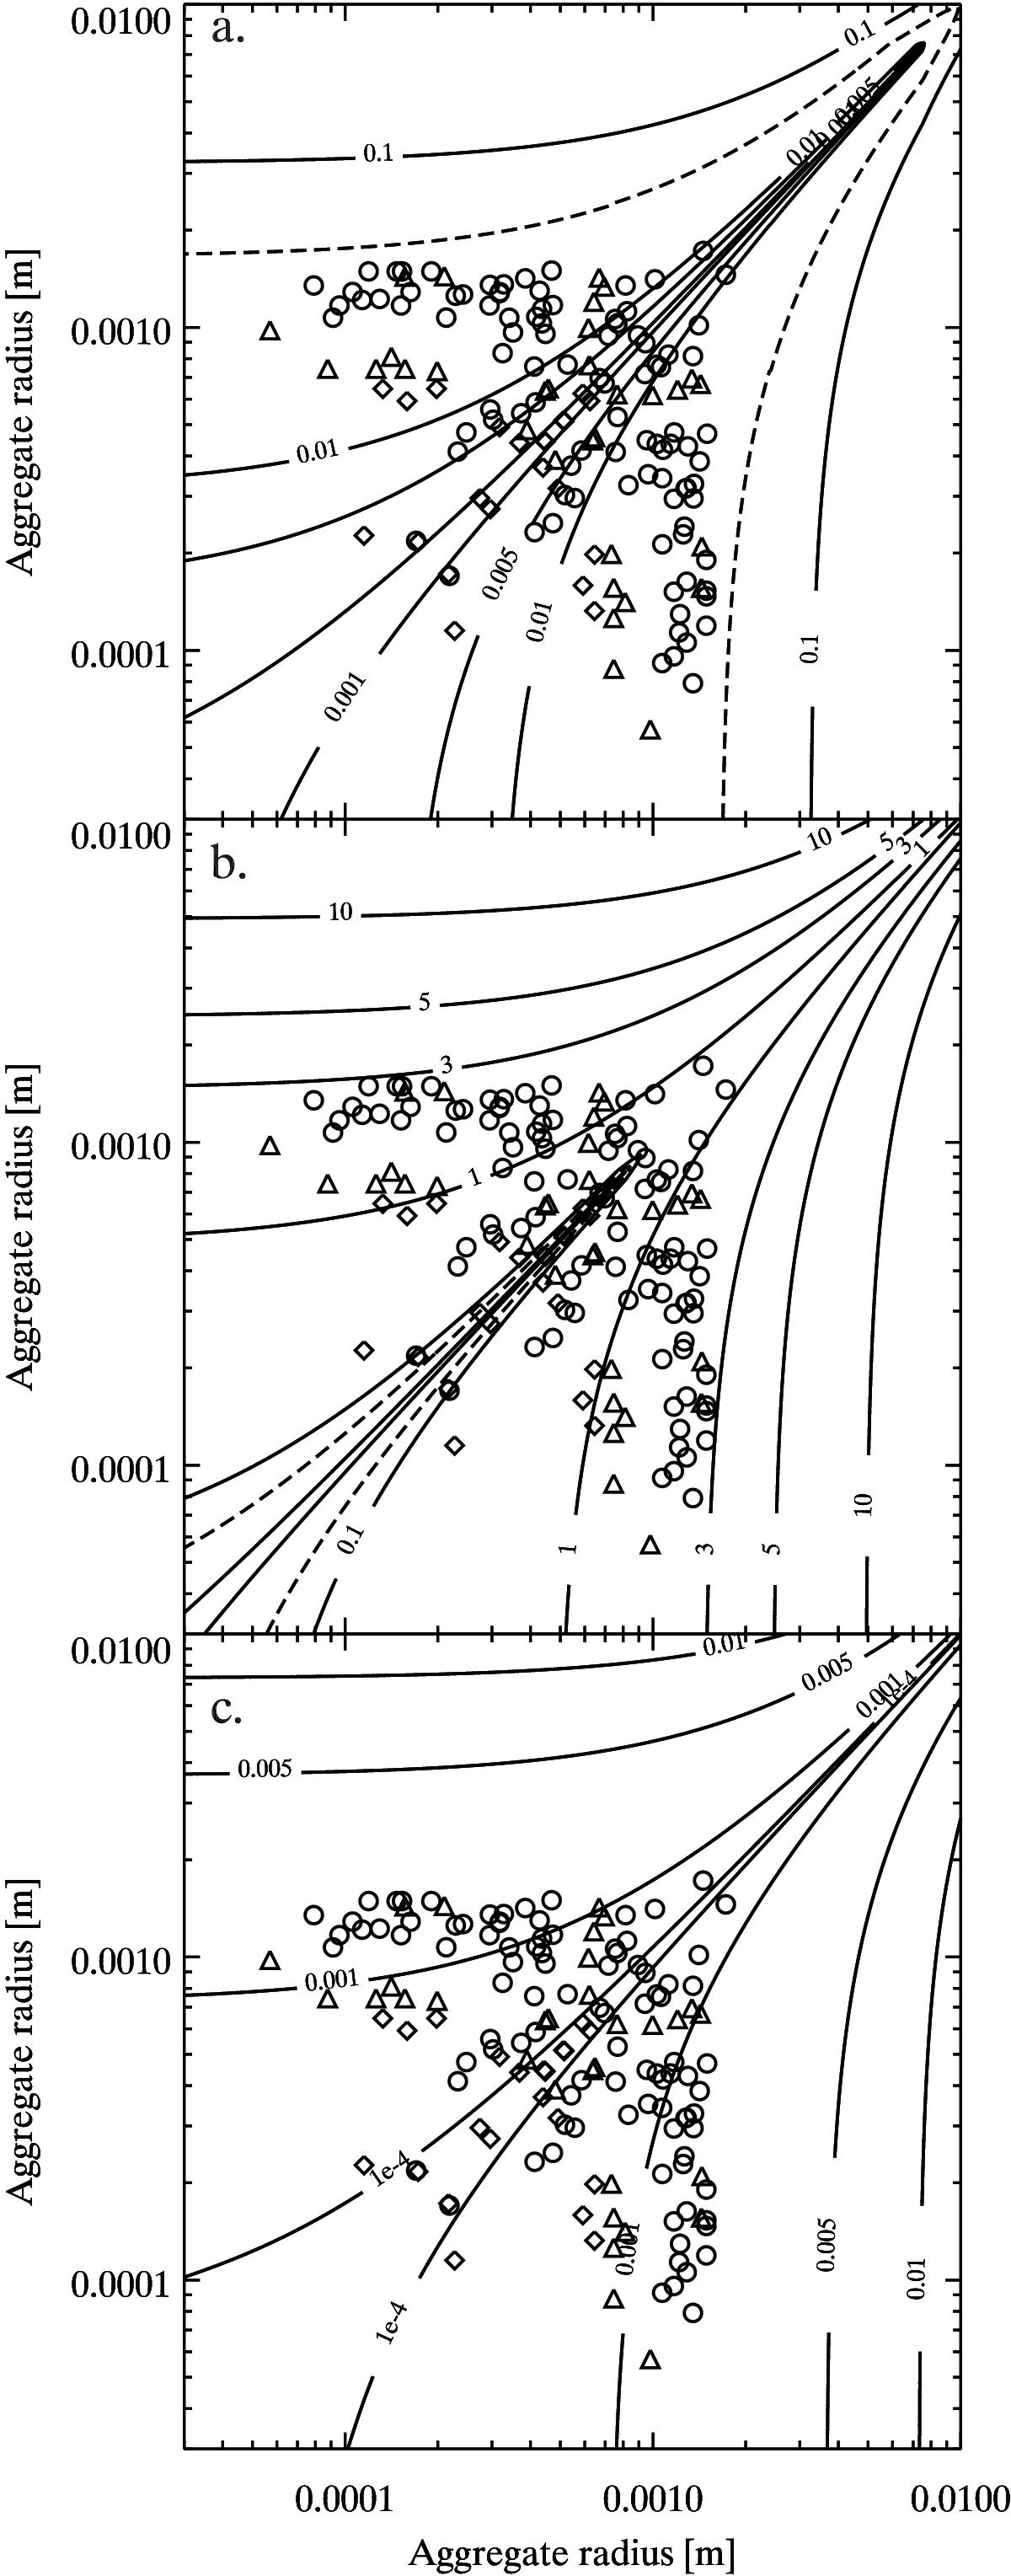
Fig. 11

Relative velocities between dust aggregates in a protoplanetary disc computed according to Weidenschilling (1977, panel a)), Andrews & Williams (2007, panel b)), and Desch (2007, panel c)); at 1 AU and a turbulence parameter of α = 10-5. The velocity profiles are labelled in units of m s-1. The sticking collisions observed are plotted as single points; circles indicate the M sample, diamonds indicate the CM sample, and triangles indicate the SP sample. The maximum speed at which sticking was observed (5.2 cm s-1) is shown as a dashed line. In panel c), the dashed contour is outside of the depicted parameter field.
Current usage metrics show cumulative count of Article Views (full-text article views including HTML views, PDF and ePub downloads, according to the available data) and Abstracts Views on Vision4Press platform.
Data correspond to usage on the plateform after 2015. The current usage metrics is available 48-96 hours after online publication and is updated daily on week days.
Initial download of the metrics may take a while.


