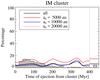
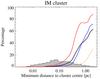
Fig. 9

Statistics for the IM cluster over the distribution of simulations (grey-shaded histogram) and the survival percentages of comets. The comet populations are shown both combined (thick black curve) and for each population (coloured curves). The survival statistics are computed as the arithmetic mean using a boxcar, and then smoothed by a Gaussian kernel. Left panel: statistics as a function of the time when the Sun is ejected from the cluster, using a boxcar width of 50 Myr and Gaussian kernel σ = 10 Myr. Cases where the Sun is not ejected from the cluster are shown to the right of the vertical dashed line. Right panel: statistics as a function of the Sun’s nearest distance to the cluster centre, computed in logarithmic bins using a boxcar width of 0.3 dex and Gaussian kernel σ = 0.05 dex.
Current usage metrics show cumulative count of Article Views (full-text article views including HTML views, PDF and ePub downloads, according to the available data) and Abstracts Views on Vision4Press platform.
Data correspond to usage on the plateform after 2015. The current usage metrics is available 48-96 hours after online publication and is updated daily on week days.
Initial download of the metrics may take a while.