Fig. 8
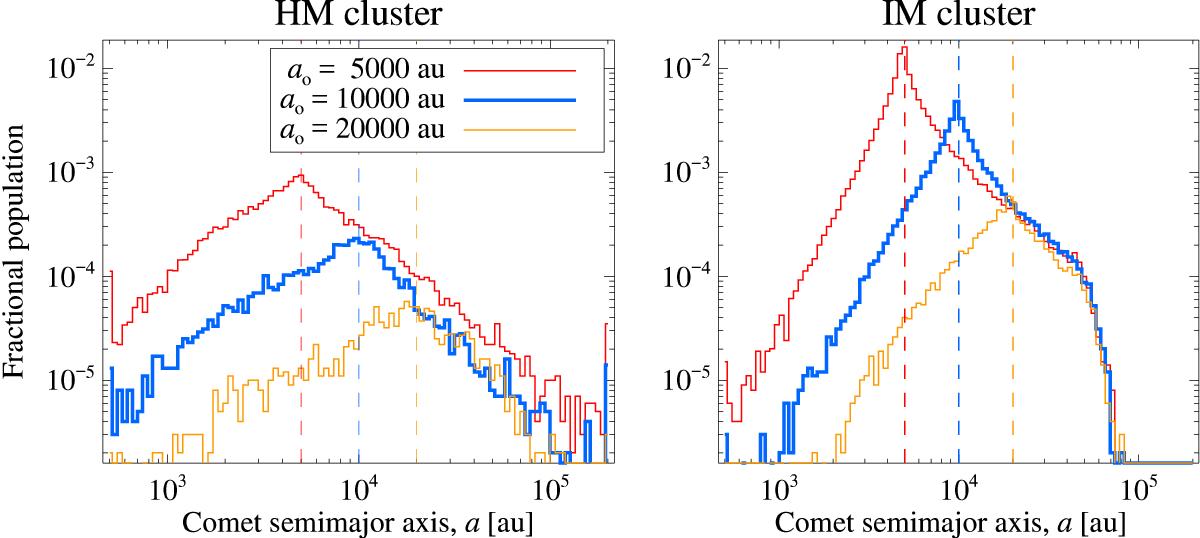
Mean semi-major axis distributions of the surviving comets at the end of the integrations, combined from all simulations, for the three primordial populations as in Fig. 6, using the same colours and styles of the curves. Vertical dashed lines represent the initial values. Differential distributions are shown by histograms, using a common normalisation to the size of the initial populations. The curves are shaped by energy perturbations caused by the external agents. Statistical noise is seen mainly for the inner and intermediate primordial populations. Left panel: the high-mass cluster. Right panel: the intermediate-mass cluster.
Current usage metrics show cumulative count of Article Views (full-text article views including HTML views, PDF and ePub downloads, according to the available data) and Abstracts Views on Vision4Press platform.
Data correspond to usage on the plateform after 2015. The current usage metrics is available 48-96 hours after online publication and is updated daily on week days.
Initial download of the metrics may take a while.