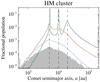
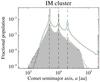
Fig. 7

Time evolution of the combined comet population of all simulations with the full dynamical model. The fractional populations are counted with respect to the total initial population. Results were sampled at 10 Myr timesteps, using 100 uniform logarithmic bins for a ∈ [500,200 000] au. The locations of the three initial sub-populations are indicated by vertical dashed lines. Here, snapshots are shown at times T = 10, 50, 200, and 400 Myr, from top to bottom, using black, red, blue and green colours, respectively, where the final time step is also shaded in grey. Comets beyond the plot limits have been summed at the edges. Left panel: the high-mass cluster. Right panel: the intermediate-mass cluster. The three remaining peaks in the final distribution reflect the fact that the vast majority of the stars in this cluster model have by then left the cluster with fossilised structures of their cometary clouds.
Current usage metrics show cumulative count of Article Views (full-text article views including HTML views, PDF and ePub downloads, according to the available data) and Abstracts Views on Vision4Press platform.
Data correspond to usage on the plateform after 2015. The current usage metrics is available 48-96 hours after online publication and is updated daily on week days.
Initial download of the metrics may take a while.