Fig. 4
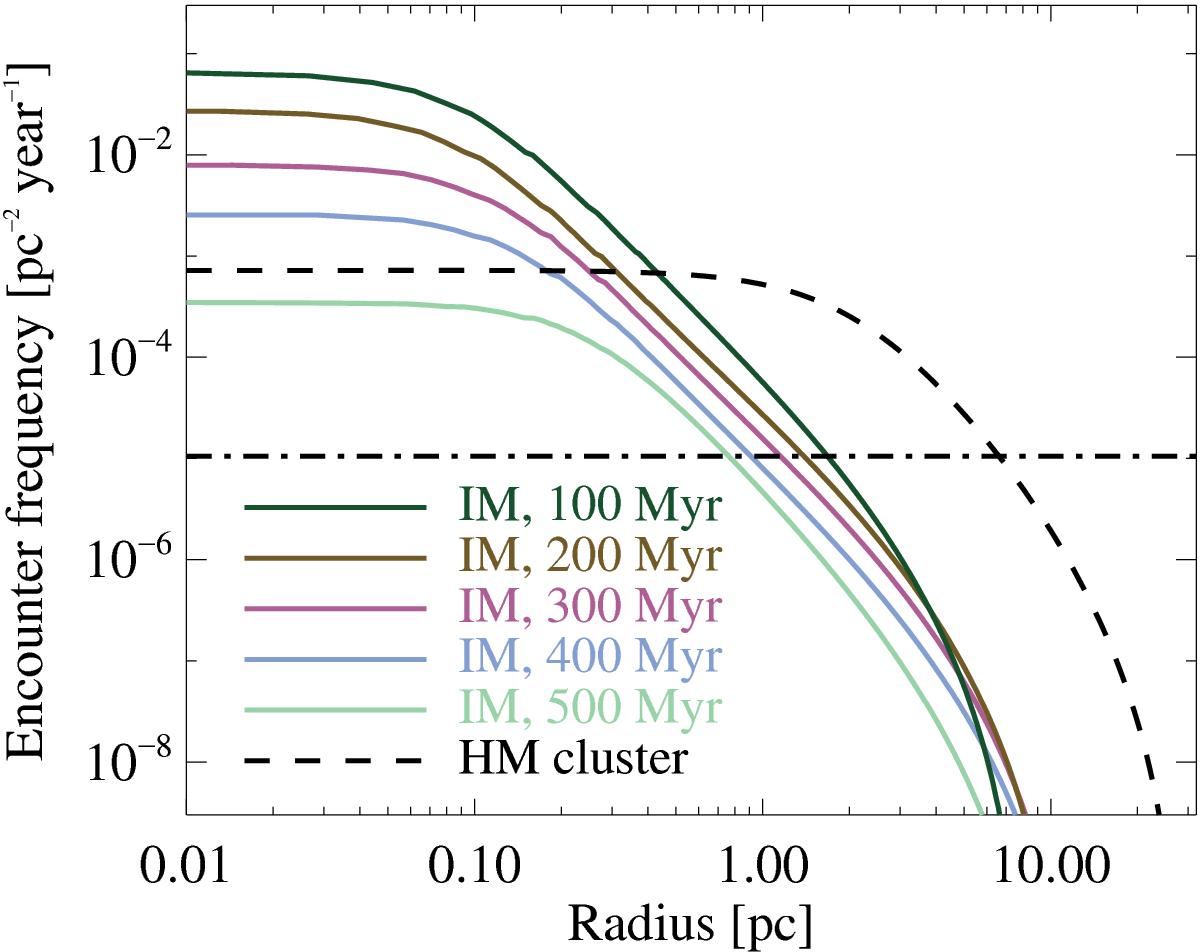
Encounter frequency versus distance from the cluster centre, shown for the high-mass cluster (dashed line) and selected time steps for the low-mass cluster (coloured solid lines). The encounter flux at the centre of the cluster decreases with increasing age for the intermediate-mass cluster – colours are the same as in Fig. 2. The horizontal dash-dotted line illustrates for comparison the current encounter frequency of the Sun with Galactic field stars (Rickman et al. 2008).
Current usage metrics show cumulative count of Article Views (full-text article views including HTML views, PDF and ePub downloads, according to the available data) and Abstracts Views on Vision4Press platform.
Data correspond to usage on the plateform after 2015. The current usage metrics is available 48-96 hours after online publication and is updated daily on week days.
Initial download of the metrics may take a while.