Fig. 2
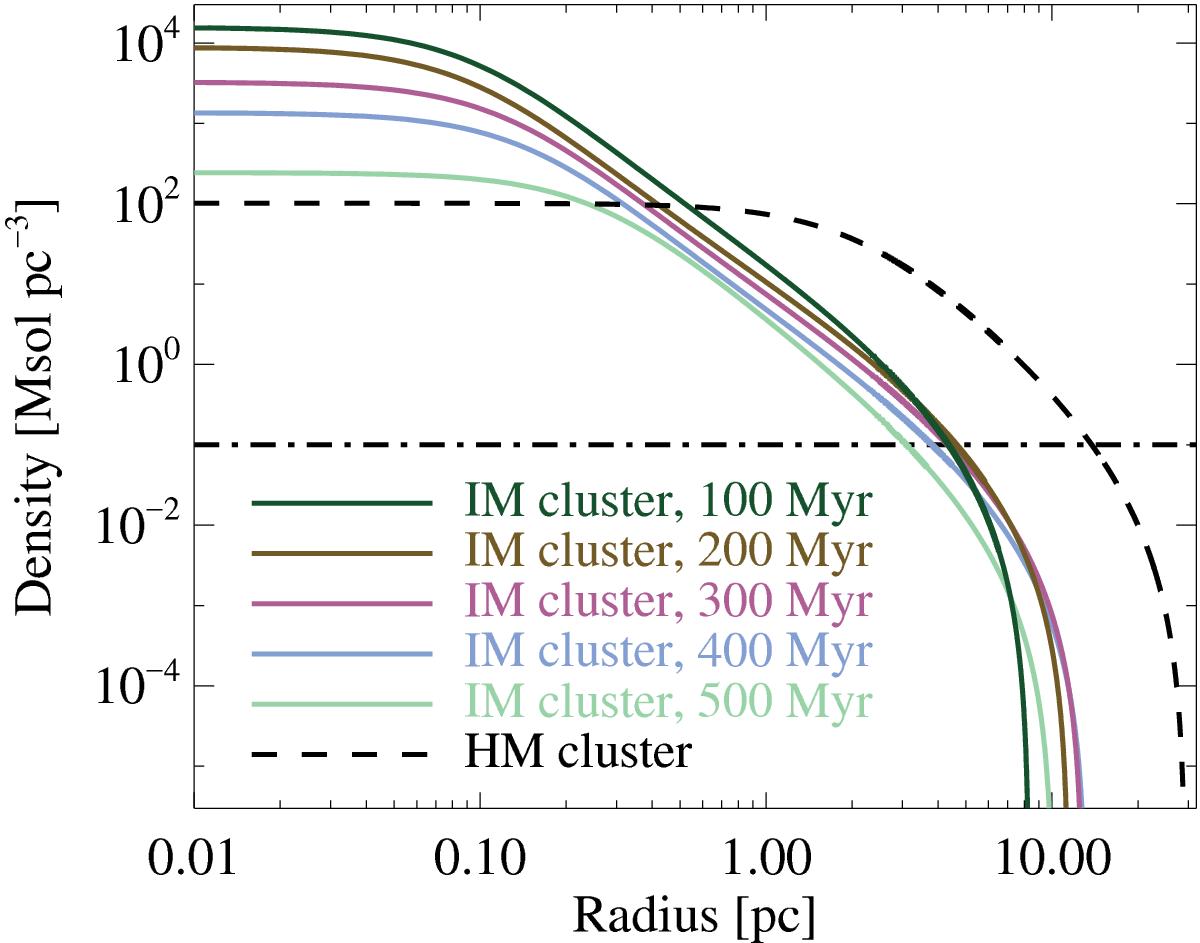
Density distribution in the template clusters. The dashed black curve indicates the distribution of the high-mass cluster, while the solid coloured curves represent time steps in the intermediate-mass model, 100 Myr apart, with the average time of each step shown in the legend. The central mass density (left end of the plot) decreases monotonically with age of the model. The horizontal dash-dotted line indicates the Galactic mid-plane density for comparison.
Current usage metrics show cumulative count of Article Views (full-text article views including HTML views, PDF and ePub downloads, according to the available data) and Abstracts Views on Vision4Press platform.
Data correspond to usage on the plateform after 2015. The current usage metrics is available 48-96 hours after online publication and is updated daily on week days.
Initial download of the metrics may take a while.