Fig. 10
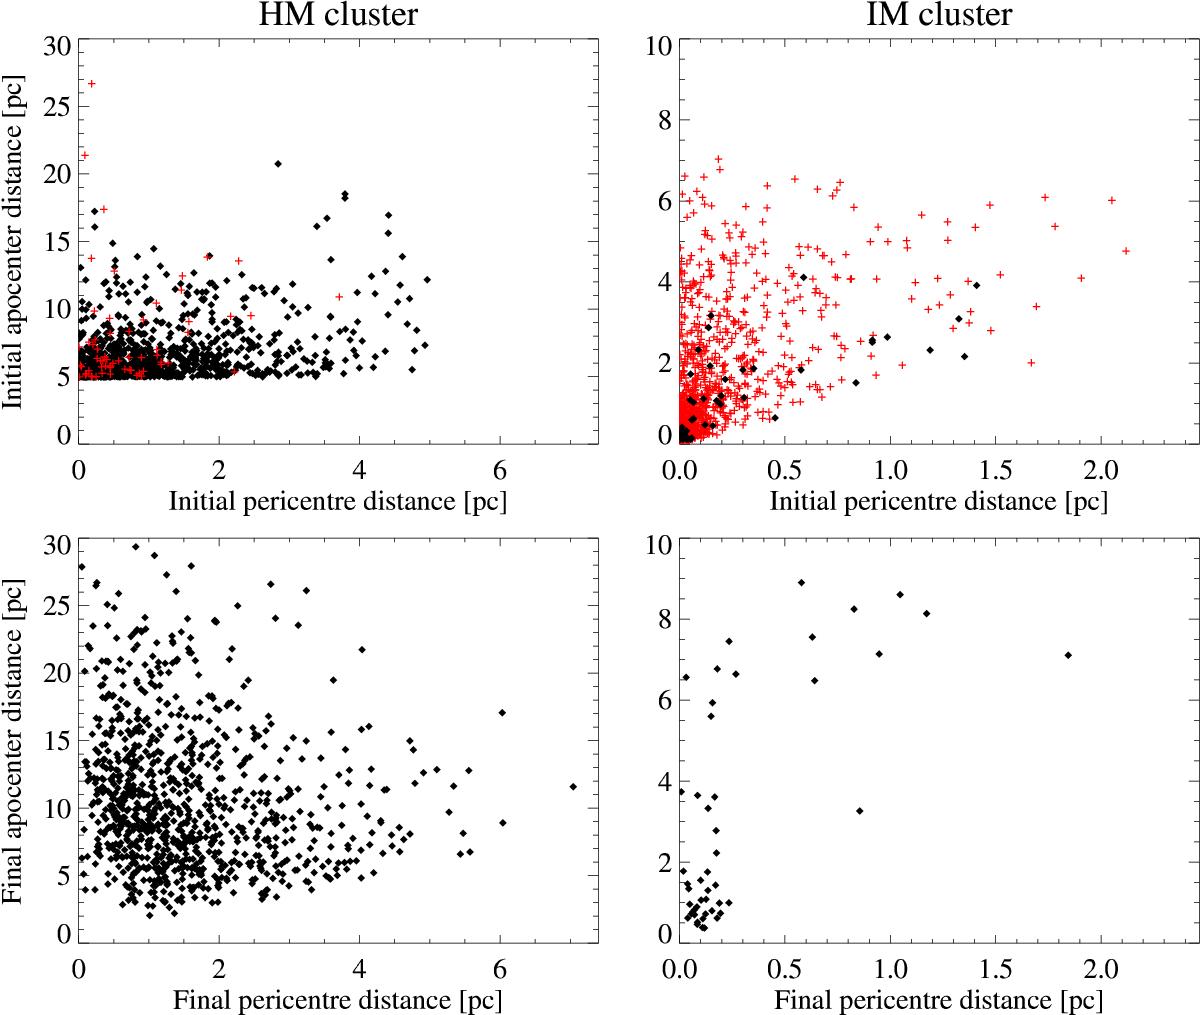
Distributions of initial and final solar orbits for all our simulations using the full dynamical model. Pericentre (q) and apocentre (Q) distances of the rosette orbits are plotted on the axes of each diagram. Left panels: the high-mass cluster. Right panels: the intermediate-mass cluster. Top panels: initial orbits. For the HM cluster, these orbits start from the half-mass radius (r = 4.87 pc) with some random radial velocity, so we always have q< 4.87 pc <Q. The red crosses denote orbits, where the Sun was ejected from the cluster during the simulation, while the rest are denoted by black diamonds. Bottom panels: final orbits. Only orbits where the Sun survived as a cluster member are shown.
Current usage metrics show cumulative count of Article Views (full-text article views including HTML views, PDF and ePub downloads, according to the available data) and Abstracts Views on Vision4Press platform.
Data correspond to usage on the plateform after 2015. The current usage metrics is available 48-96 hours after online publication and is updated daily on week days.
Initial download of the metrics may take a while.