Fig. 1
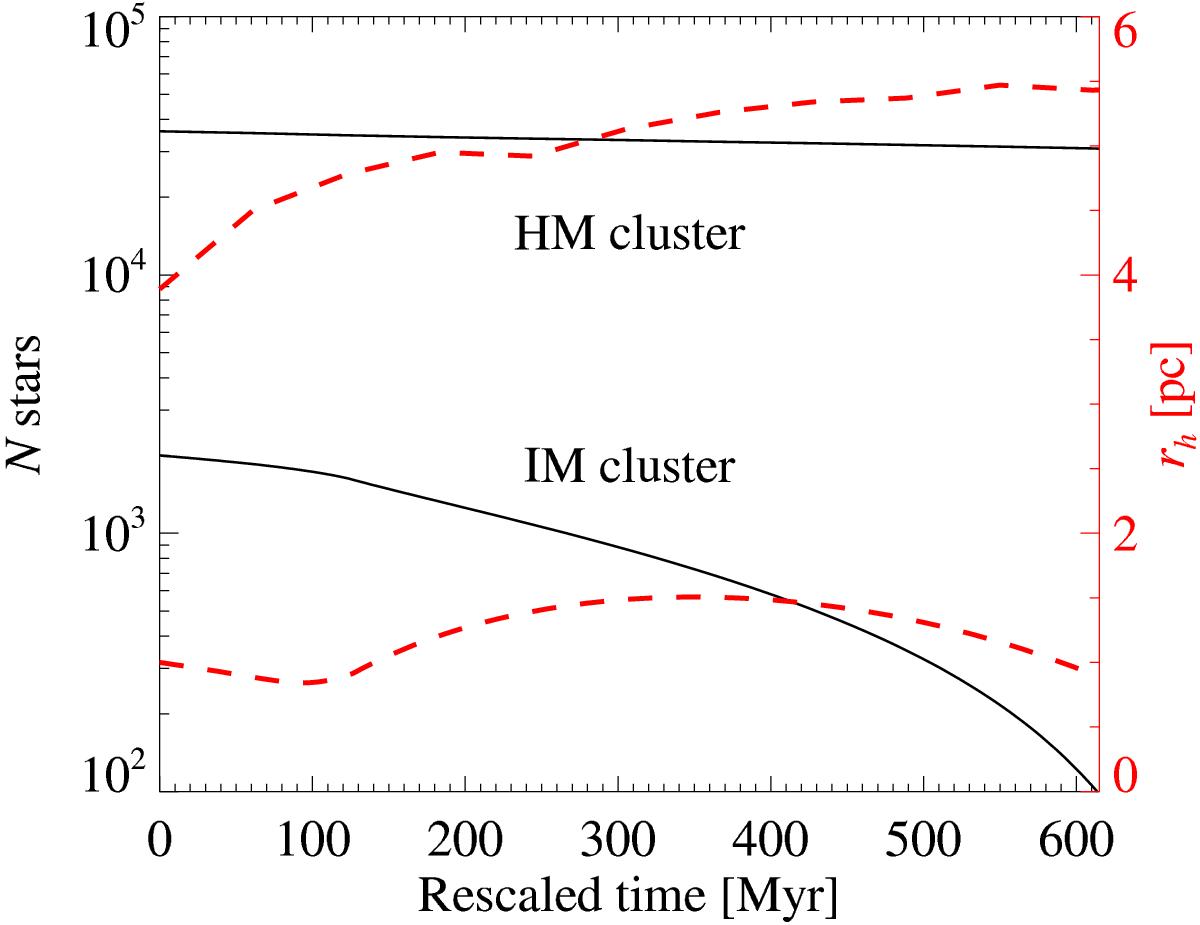
The number of stars (solid, black lines) in our high-mass and intermediate-mass cluster models, and their half-mass radii (dashed, red lines), versus time from cluster formation. A logarithmic scale is used for the number of stars and a linear scale for the radius. The time has been rescaled for the IM cluster to take the expected influence of GMCs into consideration (see text).
Current usage metrics show cumulative count of Article Views (full-text article views including HTML views, PDF and ePub downloads, according to the available data) and Abstracts Views on Vision4Press platform.
Data correspond to usage on the plateform after 2015. The current usage metrics is available 48-96 hours after online publication and is updated daily on week days.
Initial download of the metrics may take a while.