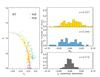
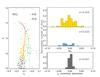
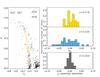
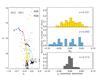
Fig. 3

Colour-magnitude diagrams of b vs. cy and cy spreads for M 3 (top left), M 92 (top right), NGC 362 (bottom left), and NGC 1851 (bottom right). In all plots the RGB stars are given by the yellow bullets, while the blue bullets represent the AGB stars. The typical photometric uncertainty for each group is given by the error bars in the upper right part of the CMDs (yellow for RGB and blue for AGB) and the bottom histogram in each plot shows the distribution of the photometric uncertainties in cy. The fiducial sequences for the RGB and AGB are also plotted in the CMDs. The coloured histograms show the spread around these fiducial sequences. The standard deviation σ is also given. Abundance information for some of the stars in NGC 1851 is overplotted in the bottom right CMD, where navy blue and purple indicate FG stars and red and green indicate SG stars based on the CNO and Na abundances available in the literature (see text).
Current usage metrics show cumulative count of Article Views (full-text article views including HTML views, PDF and ePub downloads, according to the available data) and Abstracts Views on Vision4Press platform.
Data correspond to usage on the plateform after 2015. The current usage metrics is available 48-96 hours after online publication and is updated daily on week days.
Initial download of the metrics may take a while.