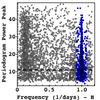
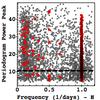
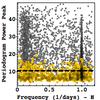
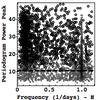
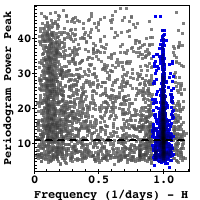
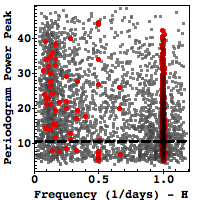
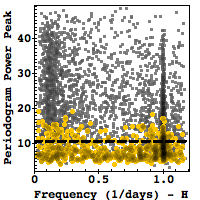
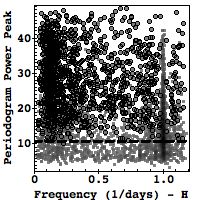
Fig. 8
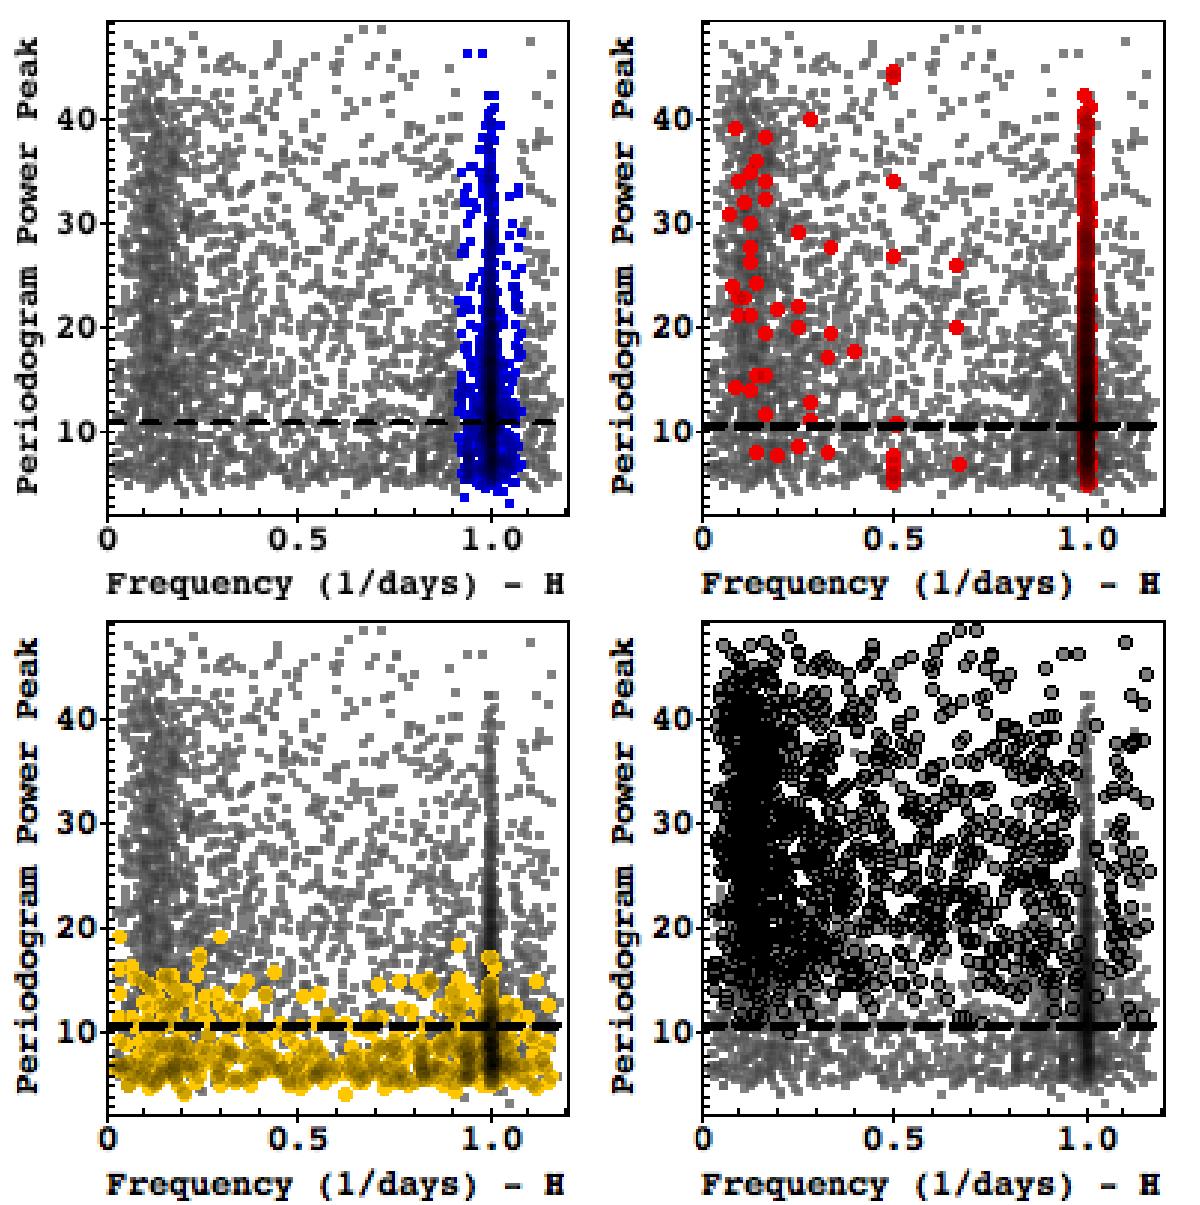
Periodogram power peak vs. frequency from the selected peak distributions for the H band. All candidate members are shown as gray dots. (Top-left) Stars discarded owing to frequencies around 1 day-1 are shown in blue. (Top-right) Stars discarded owing to S-statistics limit are shown in red. (Bottom-left) Stars discarded owing to RL-statistics limit are shown in yellow. (Bottom-right) Stars selected as periodic stars are shown as black empty circles. The PFAc limit for the H band is shown as a black dashed line.
Current usage metrics show cumulative count of Article Views (full-text article views including HTML views, PDF and ePub downloads, according to the available data) and Abstracts Views on Vision4Press platform.
Data correspond to usage on the plateform after 2015. The current usage metrics is available 48-96 hours after online publication and is updated daily on week days.
Initial download of the metrics may take a while.