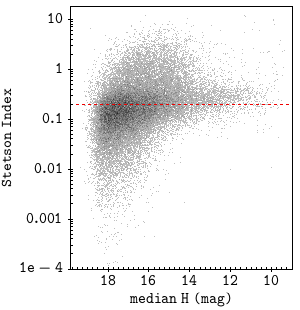
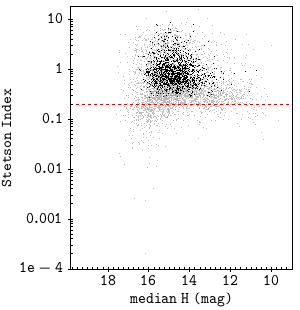
Fig. 7
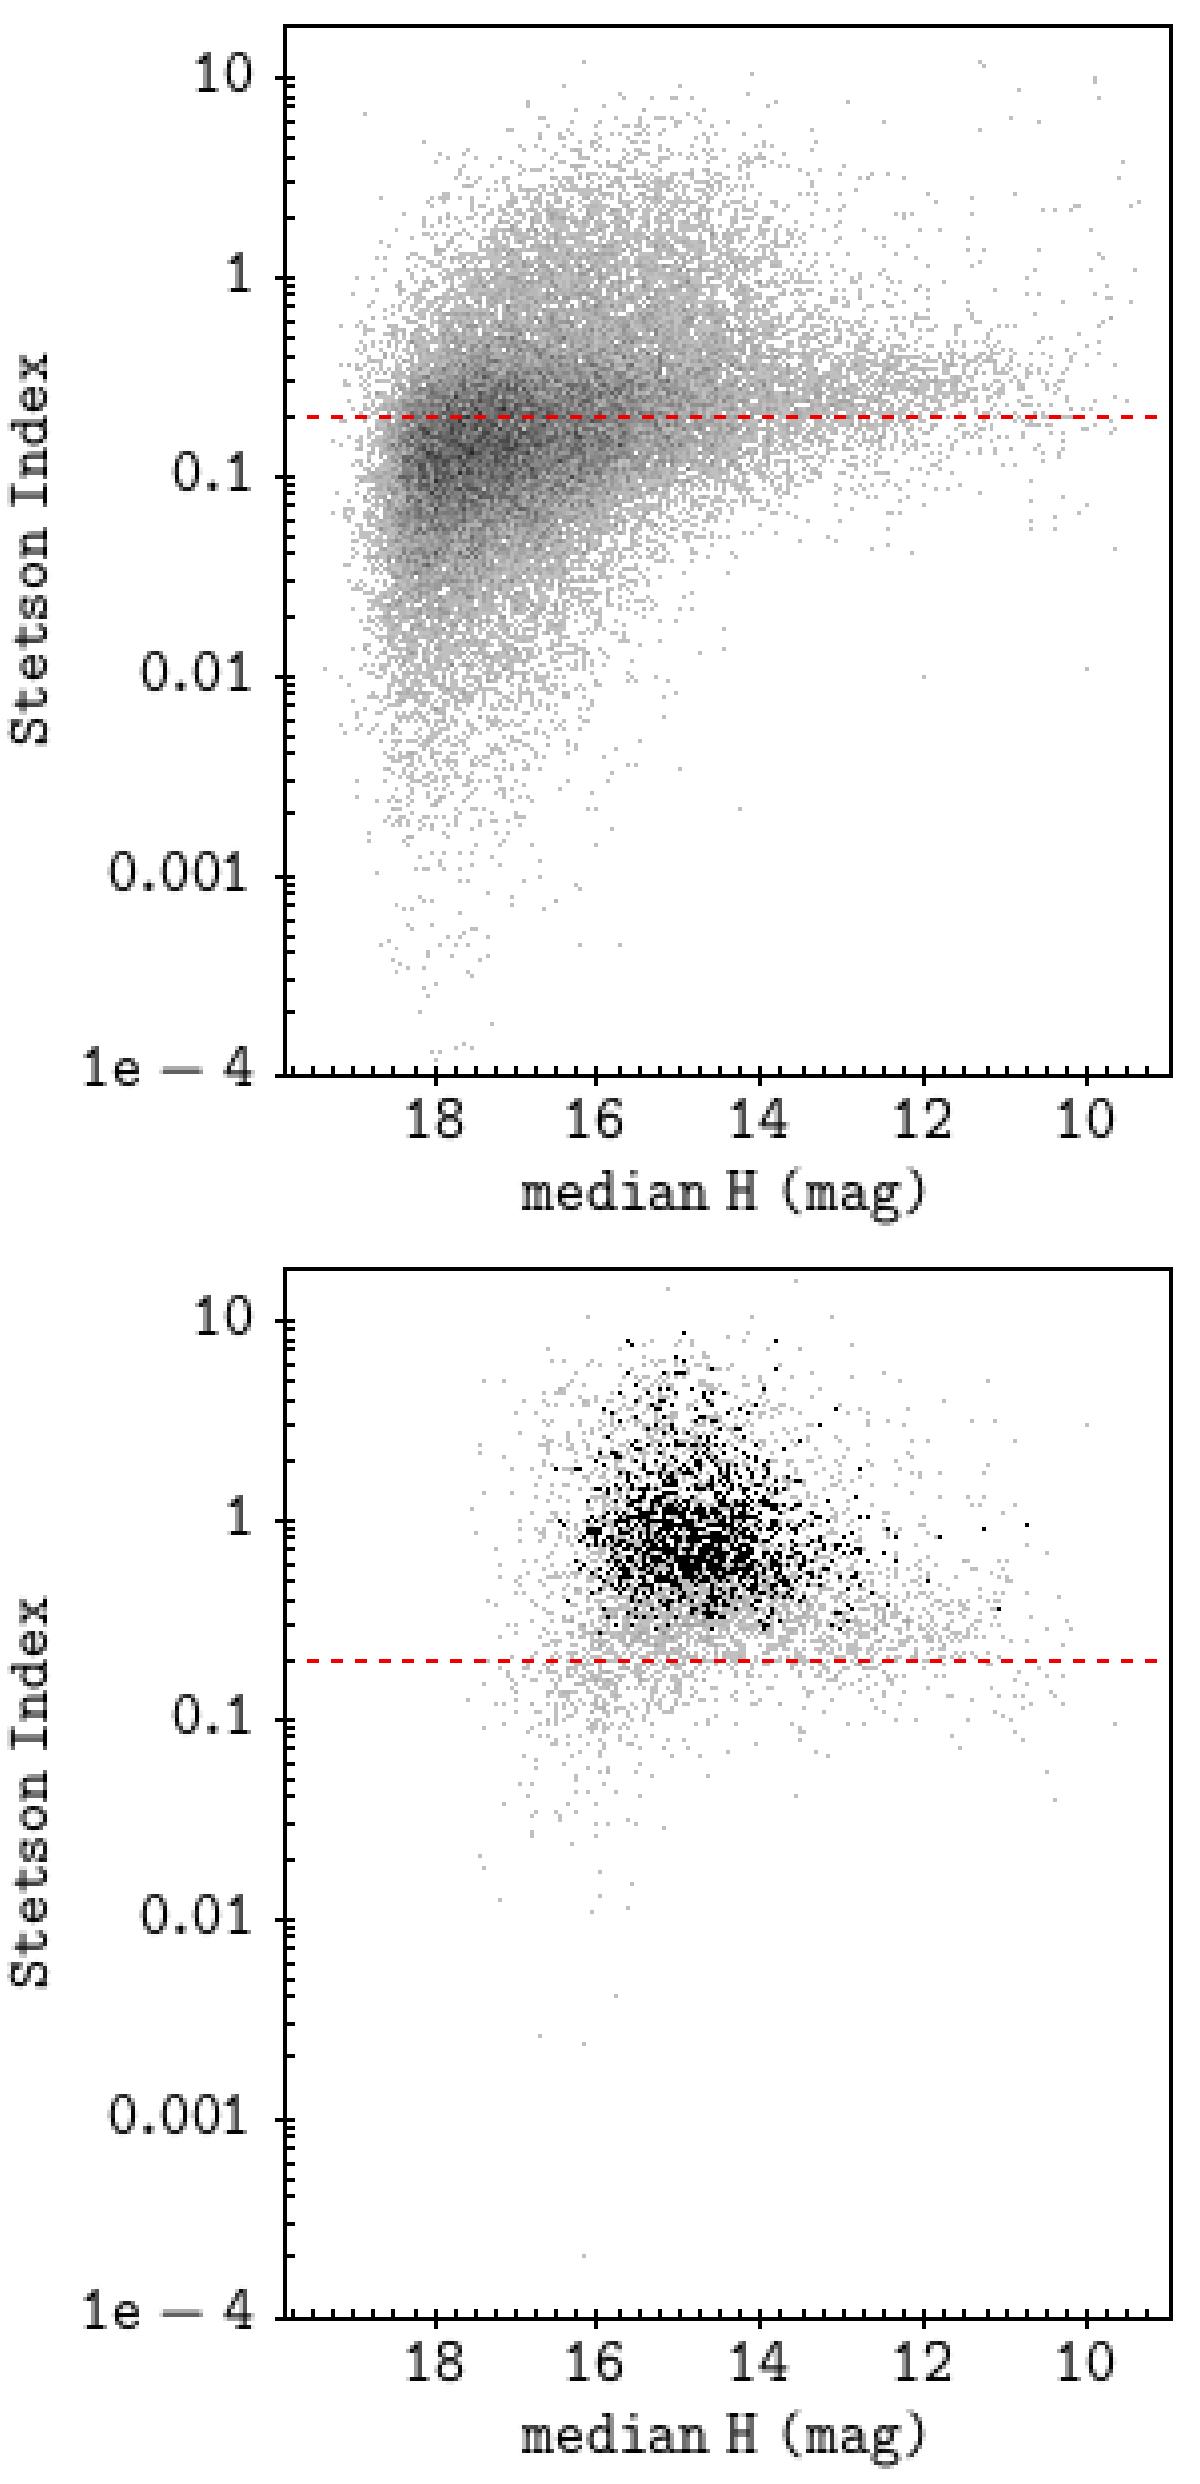
Distribution of 3-band Stetson variability index vs. mean H magnitude. Top: 36 365 objects from control sample with 3 band light curve. Higher density of points is shown as darker gray. Bottom: 5083 stars from the candidate member catalog. In both panels, the 3-band light curve is plotted as light gray dots, and darker gray shows regions with high density of points. The dashed red lines show the selection value S = 0.25. In the right plot, periodic stars are plotted in black.
Current usage metrics show cumulative count of Article Views (full-text article views including HTML views, PDF and ePub downloads, according to the available data) and Abstracts Views on Vision4Press platform.
Data correspond to usage on the plateform after 2015. The current usage metrics is available 48-96 hours after online publication and is updated daily on week days.
Initial download of the metrics may take a while.