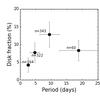
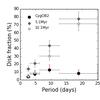
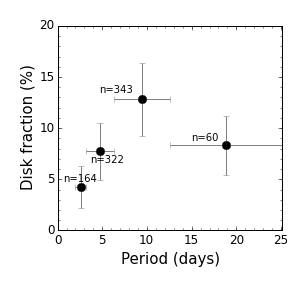
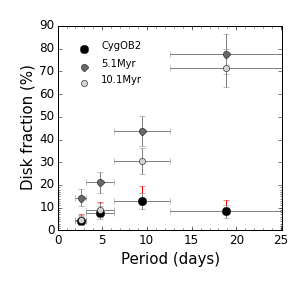
Fig. 20
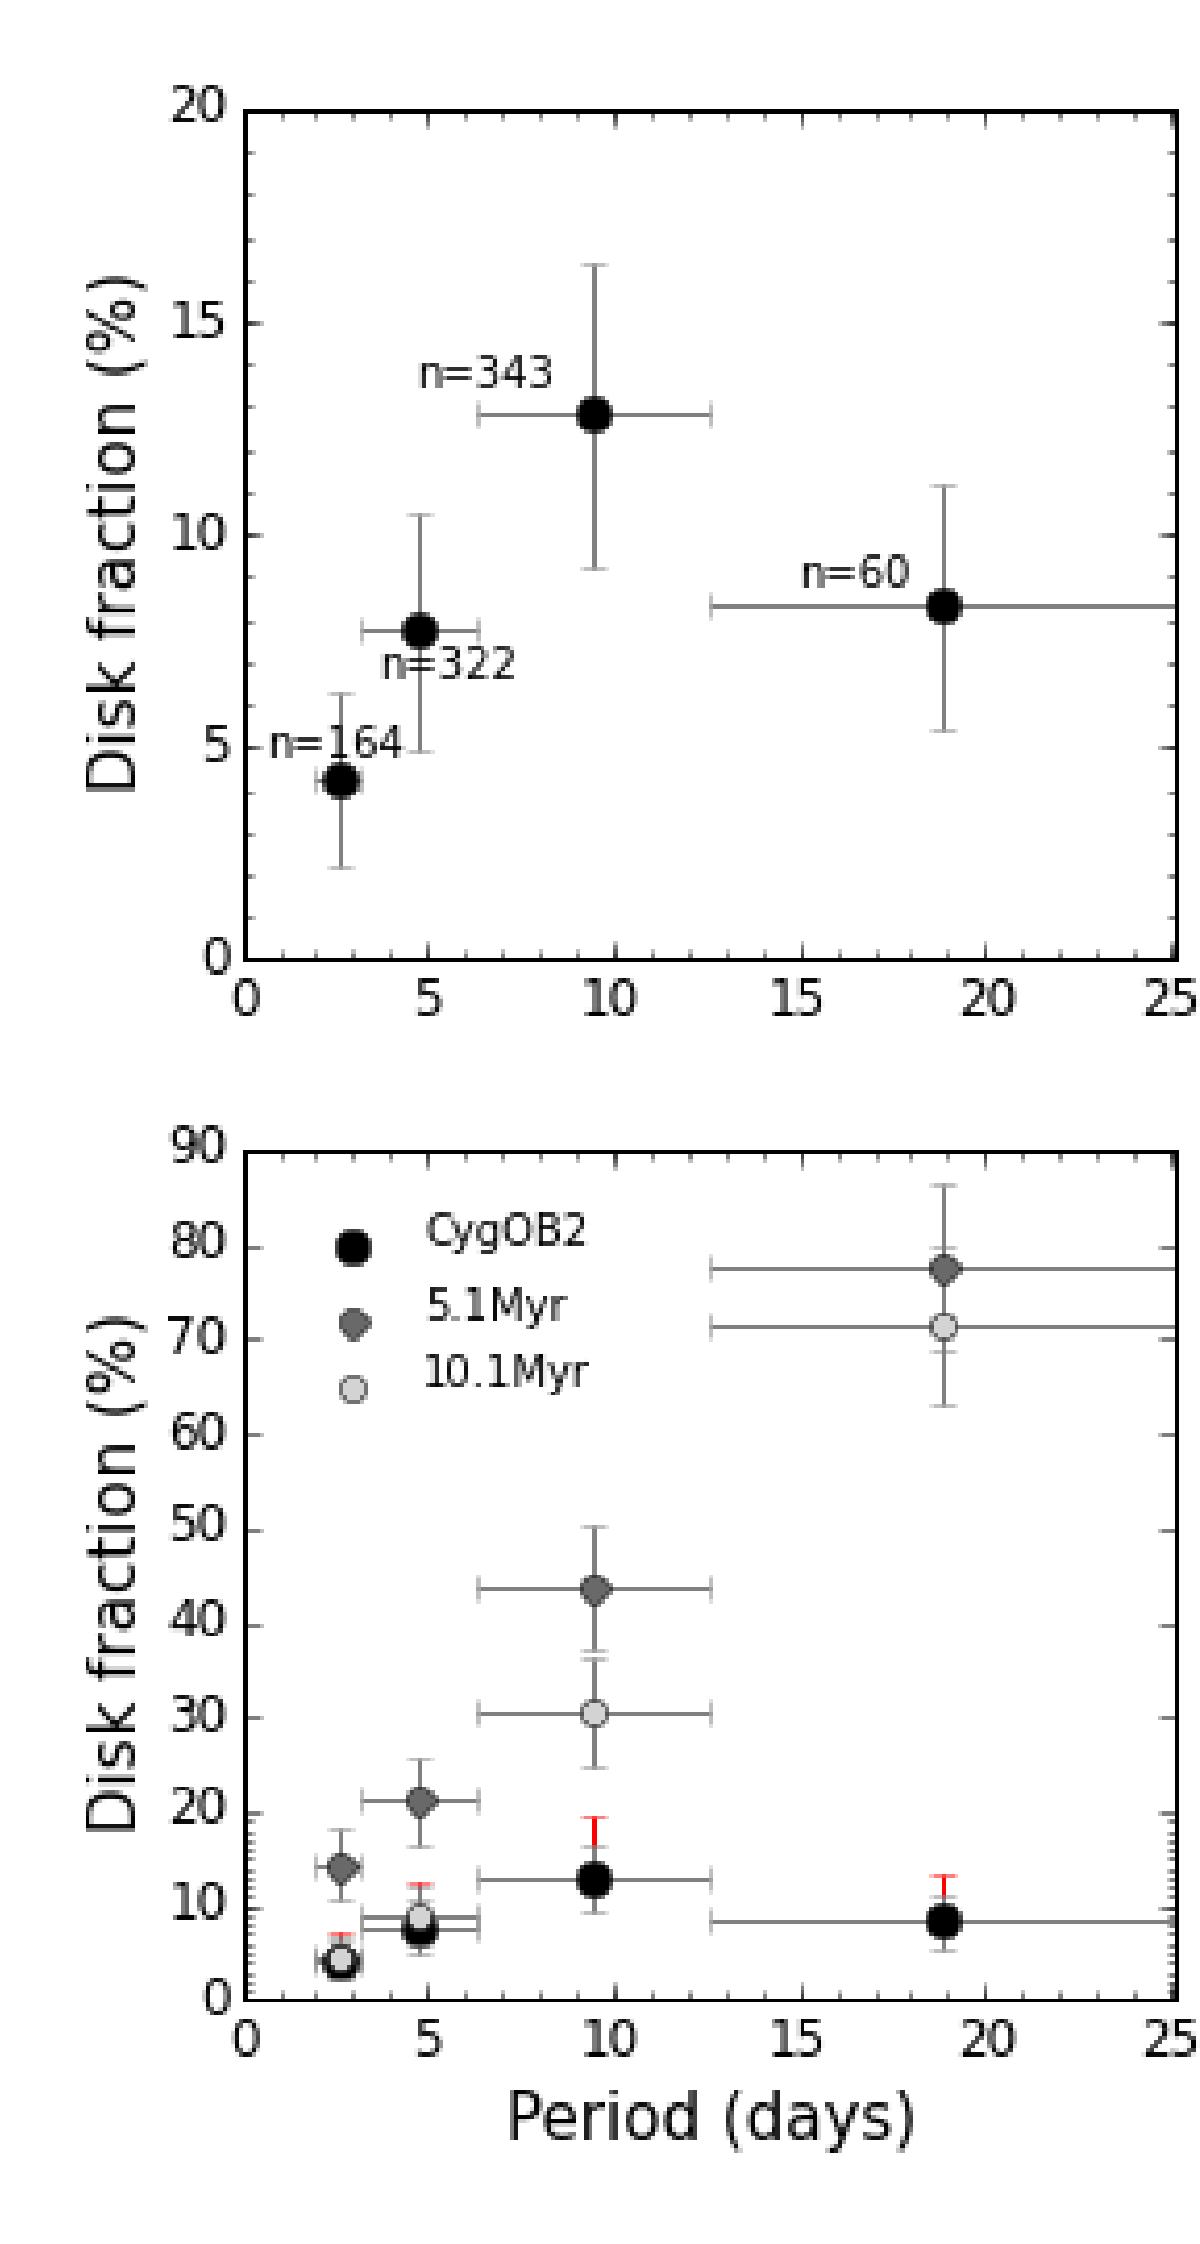
Disk fraction as a function of period. In both plots, circles show the center of each period bin, while horizontal bars indicate the size of the bin. The bins show fast, intermediate, slow, and very slow rotators. Observational data from the present study are shown as black. Top: the number of stars in each bin is shown for each point. Bottom: disk fractions resulting from M2 simulations from Vasconcelos & Bouvier (2015) for 5.1 Myr and 10.1 Myr are shown together with the fraction observed in CygOB2.
Current usage metrics show cumulative count of Article Views (full-text article views including HTML views, PDF and ePub downloads, according to the available data) and Abstracts Views on Vision4Press platform.
Data correspond to usage on the plateform after 2015. The current usage metrics is available 48-96 hours after online publication and is updated daily on week days.
Initial download of the metrics may take a while.