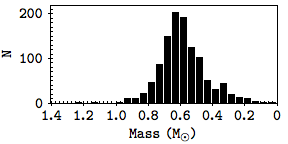
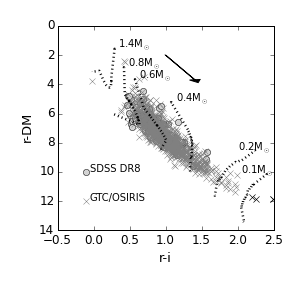
Fig. 17
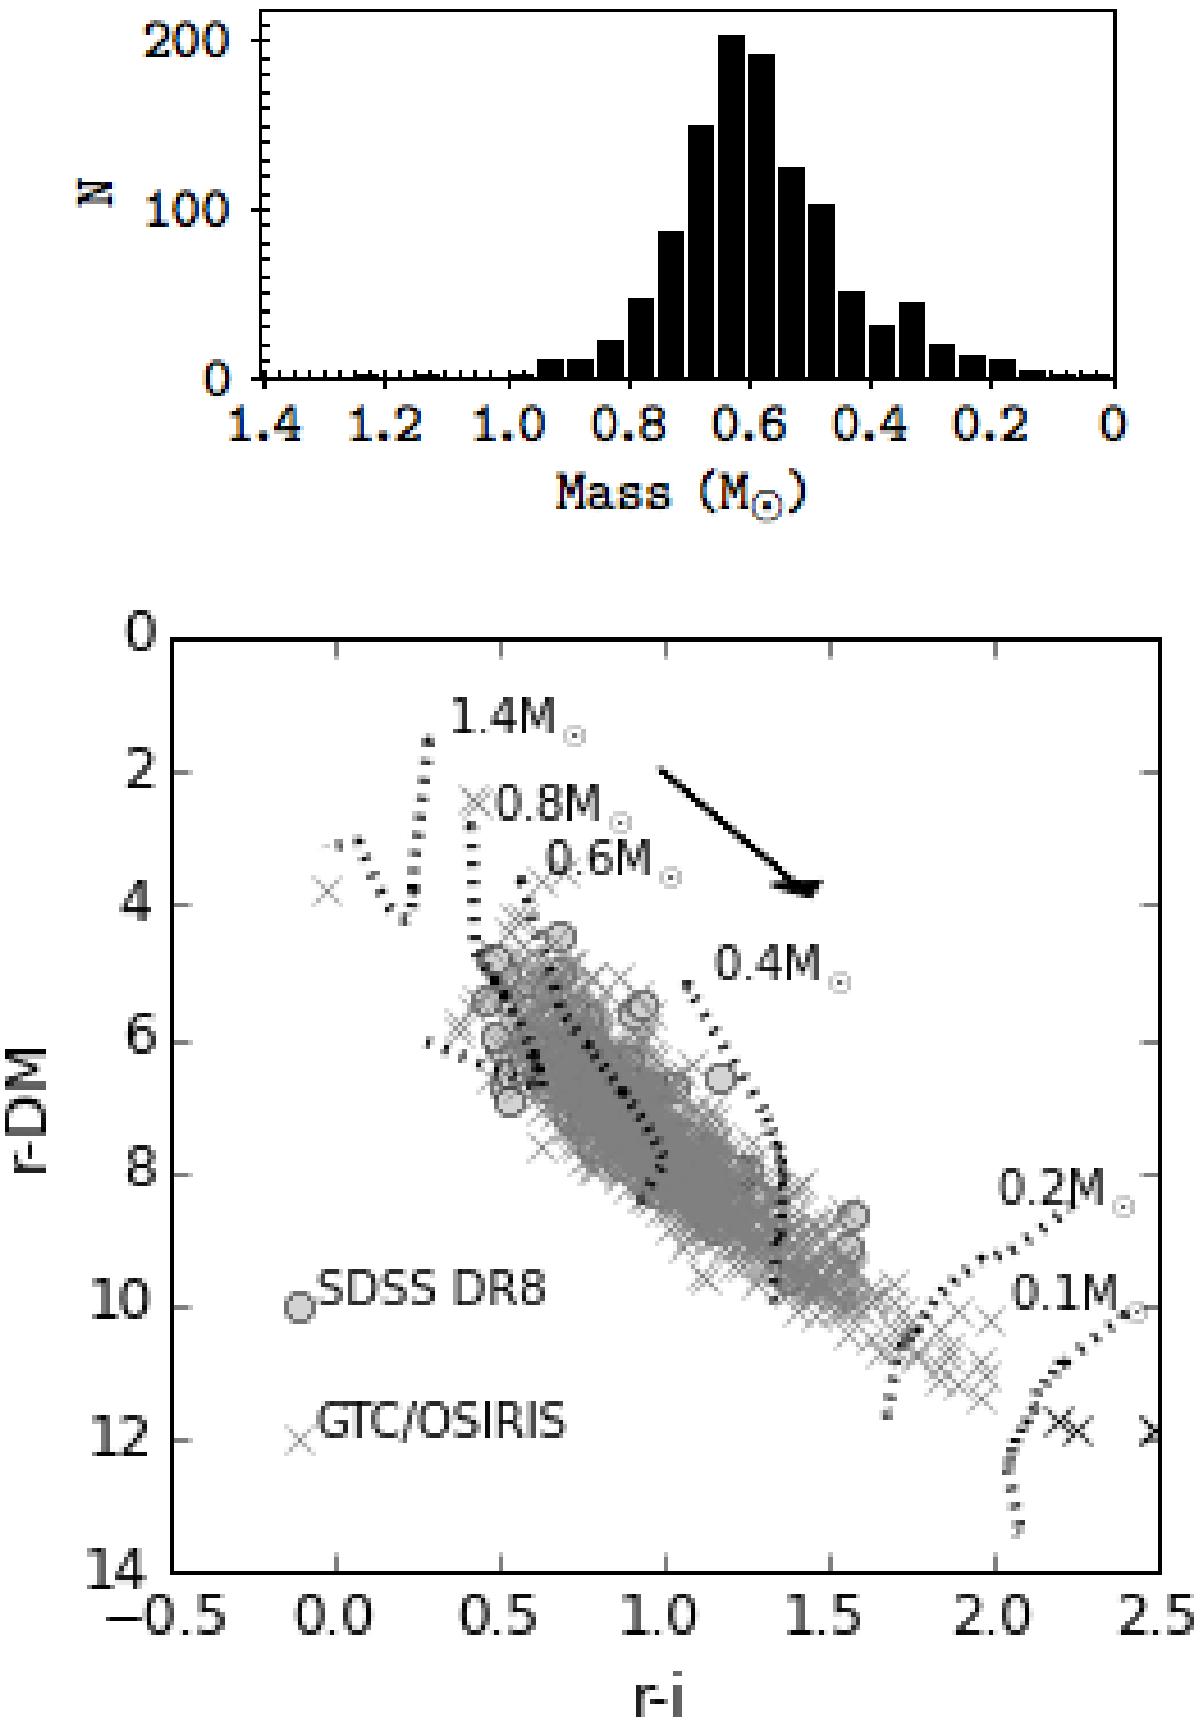
Top: histogram with mass distribution for periodic stars. Bottom: r − i vs. r-DM CMD for periodic stars. Mass tracks from Bell et al. (2014) for Pisa models (Tognelli et al. 2012) with semi-empirical corrections are shown as dotted lines. A black arrow shows a reddening vector from Schlegel et al. (1998) for AV = 2m. Black Xs show stars excluded from the mass estimation because they were too far away from the minimum mass track.
Current usage metrics show cumulative count of Article Views (full-text article views including HTML views, PDF and ePub downloads, according to the available data) and Abstracts Views on Vision4Press platform.
Data correspond to usage on the plateform after 2015. The current usage metrics is available 48-96 hours after online publication and is updated daily on week days.
Initial download of the metrics may take a while.