Fig. 10
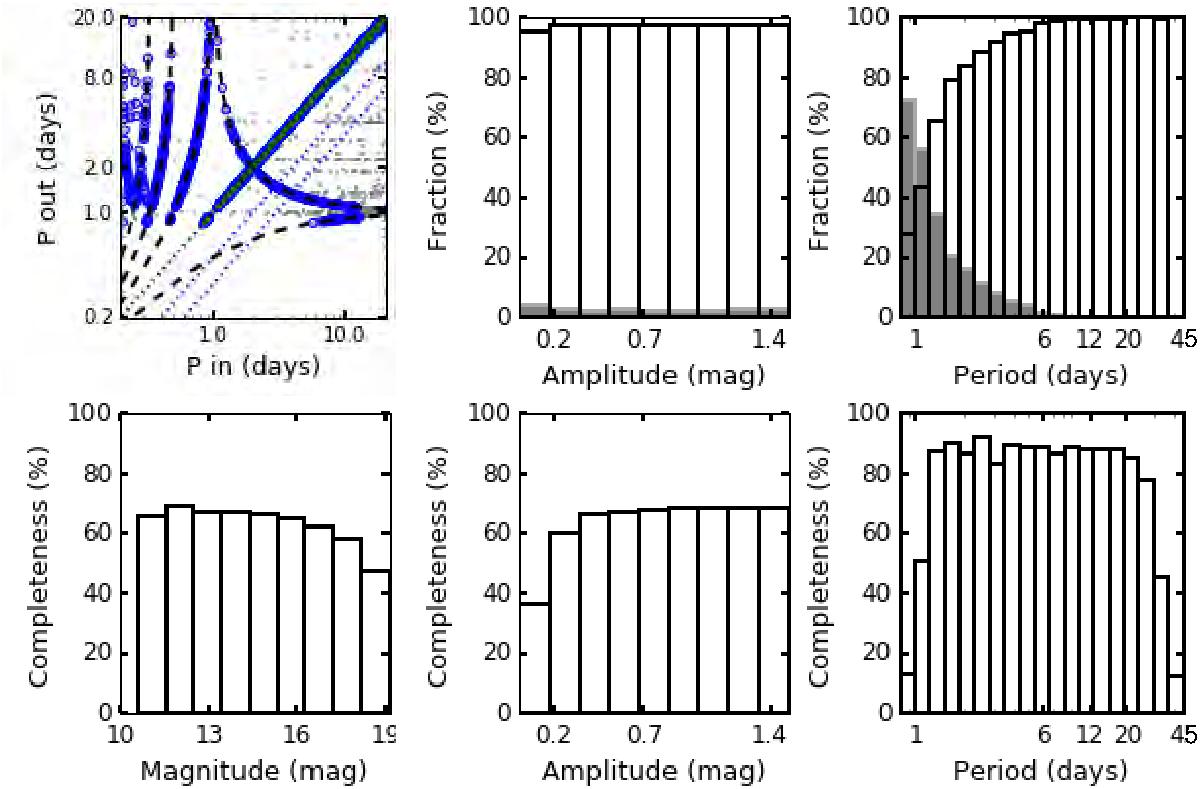
Period detection completeness and contamination levels for a mix of periodic synthetic light curves, with periods between 0.2 and 45 days and amplitudes between 0.015 and 1.5 mag. Upper left panel shows Pin × Pout diagram with every synthetic light curve shown as a gray dot, recovered sample periods shown in green, and selected sample periods shown in blue. Harmonic paths are shown as blue dotted line, and 1 day aliasing (cf. Eq. (5)) paths are shown as dashed black lines. Bottom plots: completeness distributions per magnitude (left), amplitude (medium), and period (right) bins. Top: given the selected sample, contamination levels are shown per amplitude (middle) and period (right) bins. Fraction of true recovers are shown as empty bars, and fraction of contamination are shown as filled gray bars.
Current usage metrics show cumulative count of Article Views (full-text article views including HTML views, PDF and ePub downloads, according to the available data) and Abstracts Views on Vision4Press platform.
Data correspond to usage on the plateform after 2015. The current usage metrics is available 48-96 hours after online publication and is updated daily on week days.
Initial download of the metrics may take a while.