Fig. 8
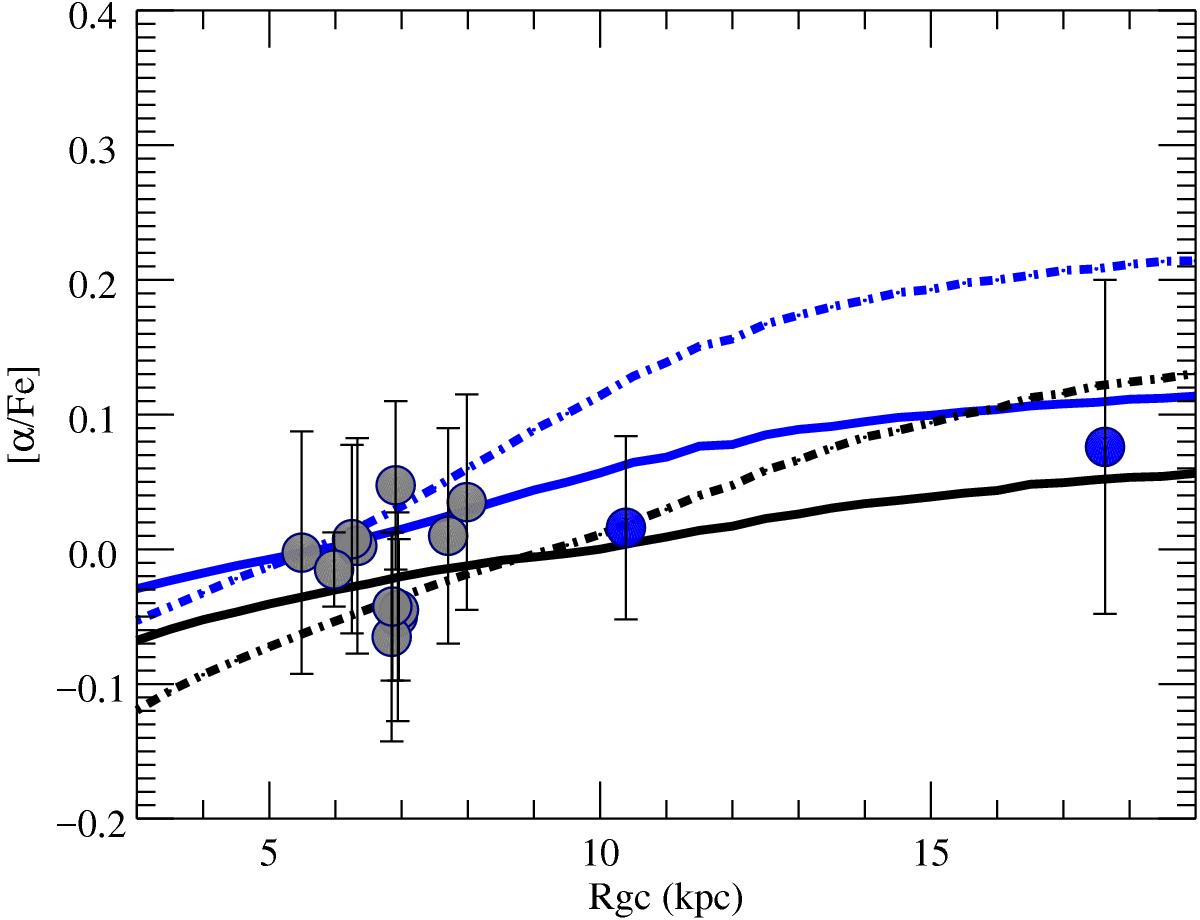
Global α-enhancement: [α/Fe] vs. RGC in the open cluster observations (colour coded by age as in Fig. 6) and in the K15-improved model (continuous lines, black at the present time and blue 5 Gyr ago). For comparison, the evolution of [O/Fe] vs. RGC is shown (dashed-dotted lines, black at the present time and blue 5 Gyr ago).
Current usage metrics show cumulative count of Article Views (full-text article views including HTML views, PDF and ePub downloads, according to the available data) and Abstracts Views on Vision4Press platform.
Data correspond to usage on the plateform after 2015. The current usage metrics is available 48-96 hours after online publication and is updated daily on week days.
Initial download of the metrics may take a while.