Free Access
Fig. 6
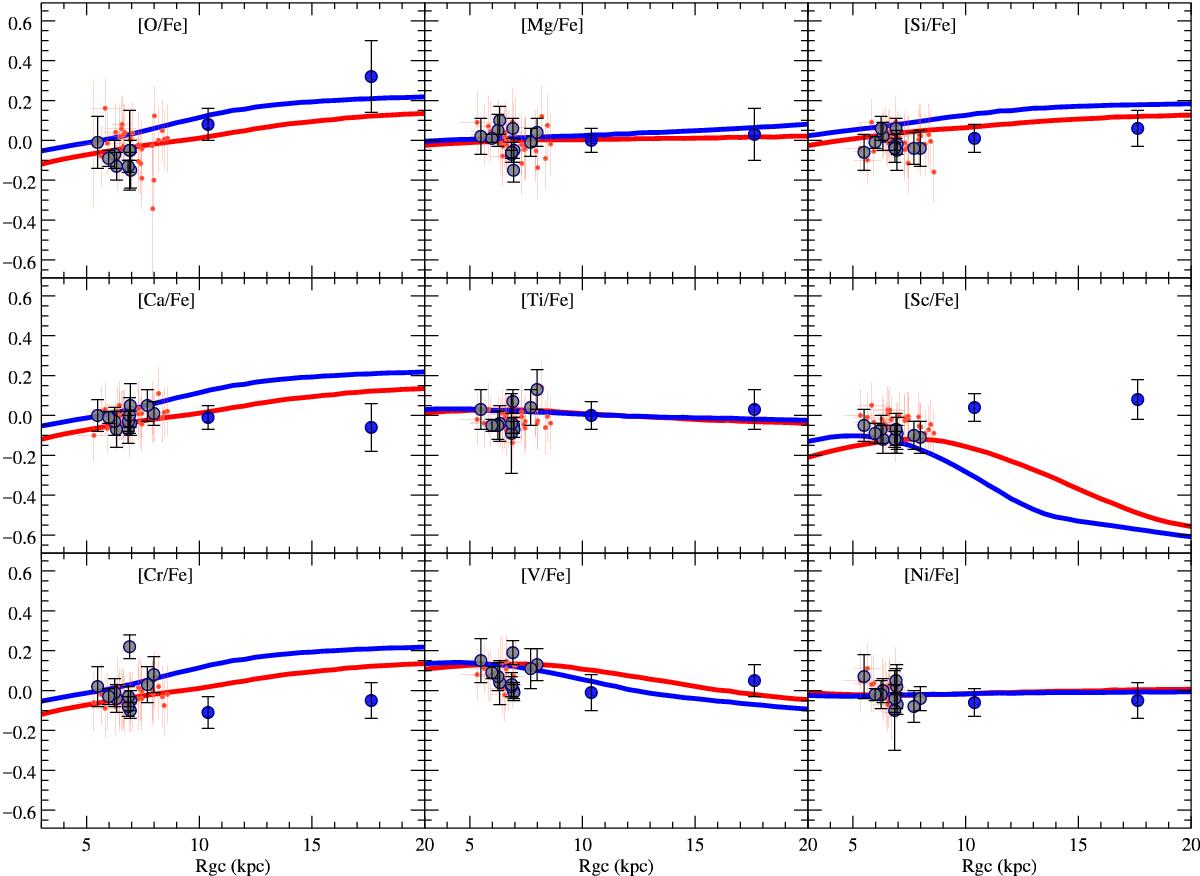
Radial abundance ratio gradients of elements belonging to different nucleosynthesis channels. For the observations, the symbols are as in Fig. 3. The red curves represent K15-improved model results at the present time, while the blue one corresponds to 5 Gyr ago.
Current usage metrics show cumulative count of Article Views (full-text article views including HTML views, PDF and ePub downloads, according to the available data) and Abstracts Views on Vision4Press platform.
Data correspond to usage on the plateform after 2015. The current usage metrics is available 48-96 hours after online publication and is updated daily on week days.
Initial download of the metrics may take a while.