Fig. 9
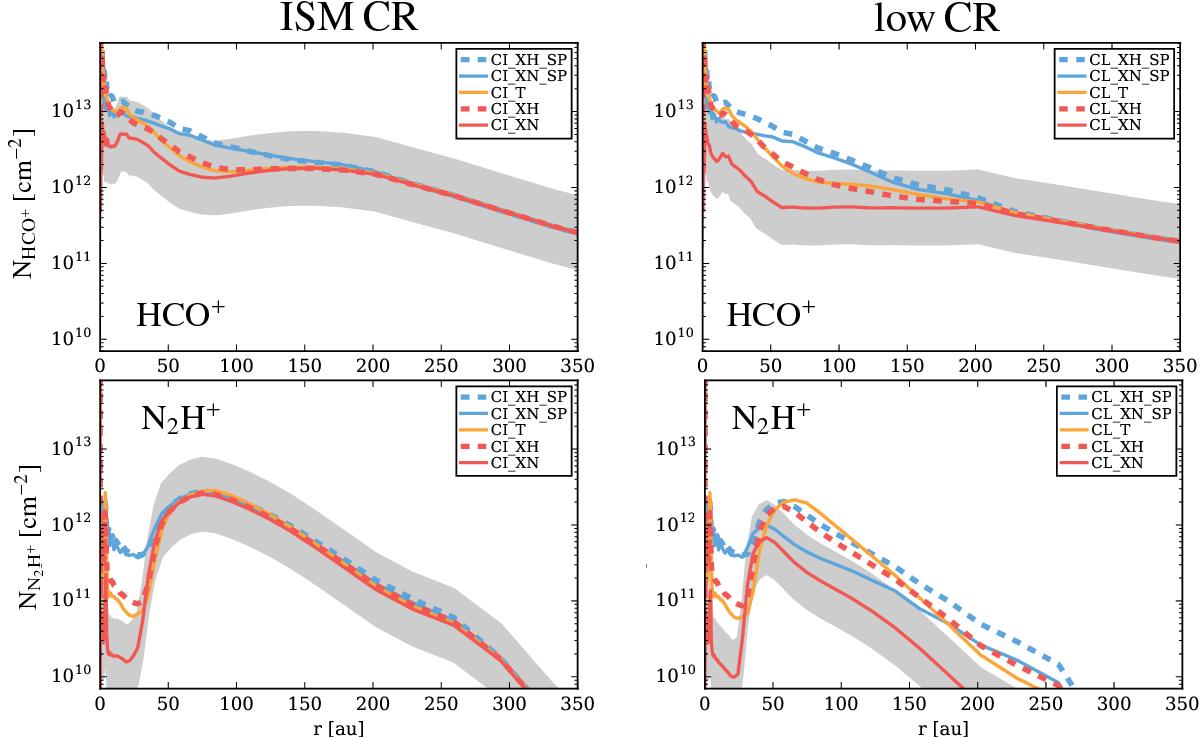
Vertical column density profiles for HCO+ and N2H+ for our model series (Table 5). The left column shows the models with the ISM like CRs (ζCR ≈ 2 × 10-17 s-1), the right column with low CRs (ζCR ≈ 2 × 10-19 s-1). The top row shows HCO+, the bottom row N2H+. The blue lines are for models with, the red lines are for models without SPs. Dashed (solid) lines are for models with high (normal) X-rays. The orange solid line shows the Turner model. The grey shaded area marks a difference of a factor 3 in the column densities relative to the CI_XN (ISM CR, normal X-rays) and CL_XN model (low CR, normal X-rays), respectively.
Current usage metrics show cumulative count of Article Views (full-text article views including HTML views, PDF and ePub downloads, according to the available data) and Abstracts Views on Vision4Press platform.
Data correspond to usage on the plateform after 2015. The current usage metrics is available 48-96 hours after online publication and is updated daily on week days.
Initial download of the metrics may take a while.