Fig. 8
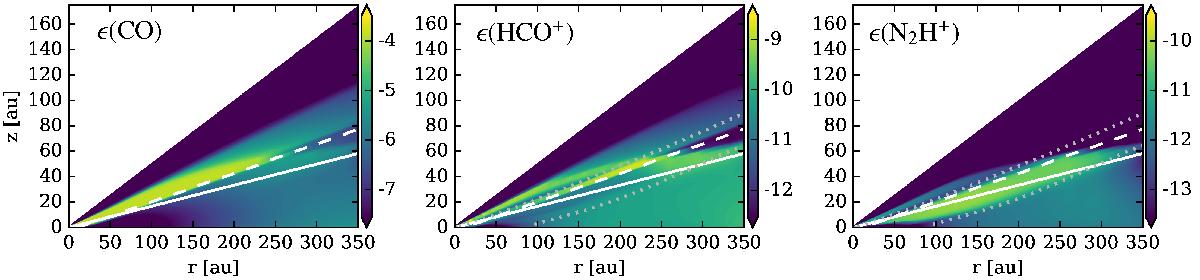
Abundances ϵ(X) relative to hydrogen for CO, HCO+ and N2H+ for the reference model CI_XN. The white solid contour line shows N⟨ H ⟩ ,rad = 1025 cm-2, the white dashed line shows the CO ice line. We call the regions above and below the CO ice line the warm and cold molecular layer, respectively. The dotted iso-contours show where the X-ray ionization rate is equal to the ISM CR (ζCR = 2 × 10-17 s-1) and equal to the low CR (ζCR = 2 × 10-19 s-1) ionization rate, respectively.
Current usage metrics show cumulative count of Article Views (full-text article views including HTML views, PDF and ePub downloads, according to the available data) and Abstracts Views on Vision4Press platform.
Data correspond to usage on the plateform after 2015. The current usage metrics is available 48-96 hours after online publication and is updated daily on week days.
Initial download of the metrics may take a while.