Fig. 7
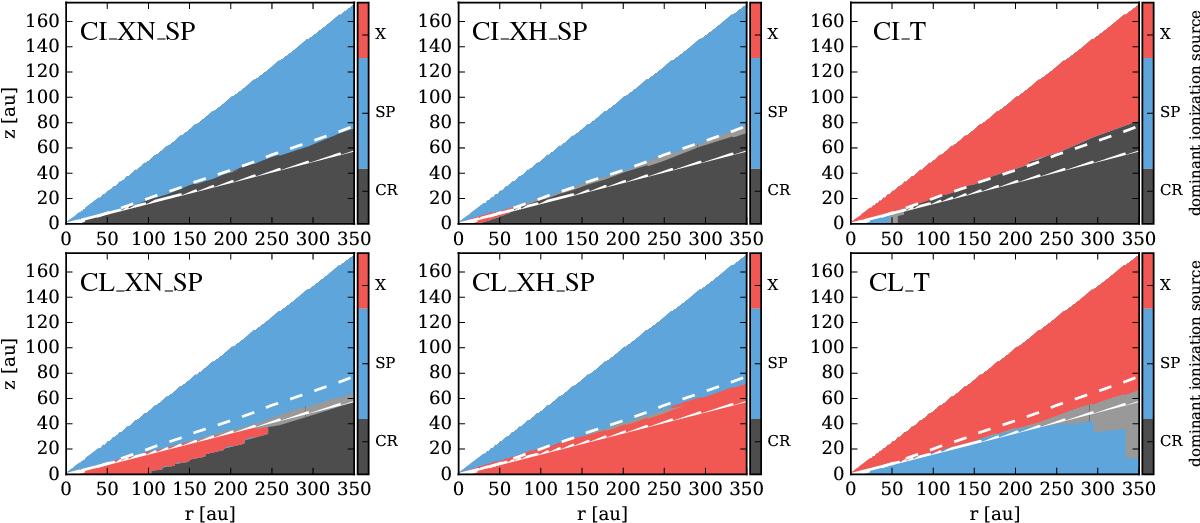
Dominant disk ionization source throughout the disk. A light grey area indicates a region without a dominant ionization source. The different possible ionization sources, X-rays, SPs and CRs are identified by the different colors (color bar). The white solid contour line shows N⟨ H ⟩ ,rad = 1025 cm-2 the white dashed line shows the CO ice line. The model names are given in the top left of each panel. Top row: models with ISM CR ionization rate (CI); bottom row: models with low CR ionization rate (CL). First column: normal X-ray models (XN); second column: high X-ray models (XH); third column: turner models (T).
Current usage metrics show cumulative count of Article Views (full-text article views including HTML views, PDF and ePub downloads, according to the available data) and Abstracts Views on Vision4Press platform.
Data correspond to usage on the plateform after 2015. The current usage metrics is available 48-96 hours after online publication and is updated daily on week days.
Initial download of the metrics may take a while.