Fig. 2
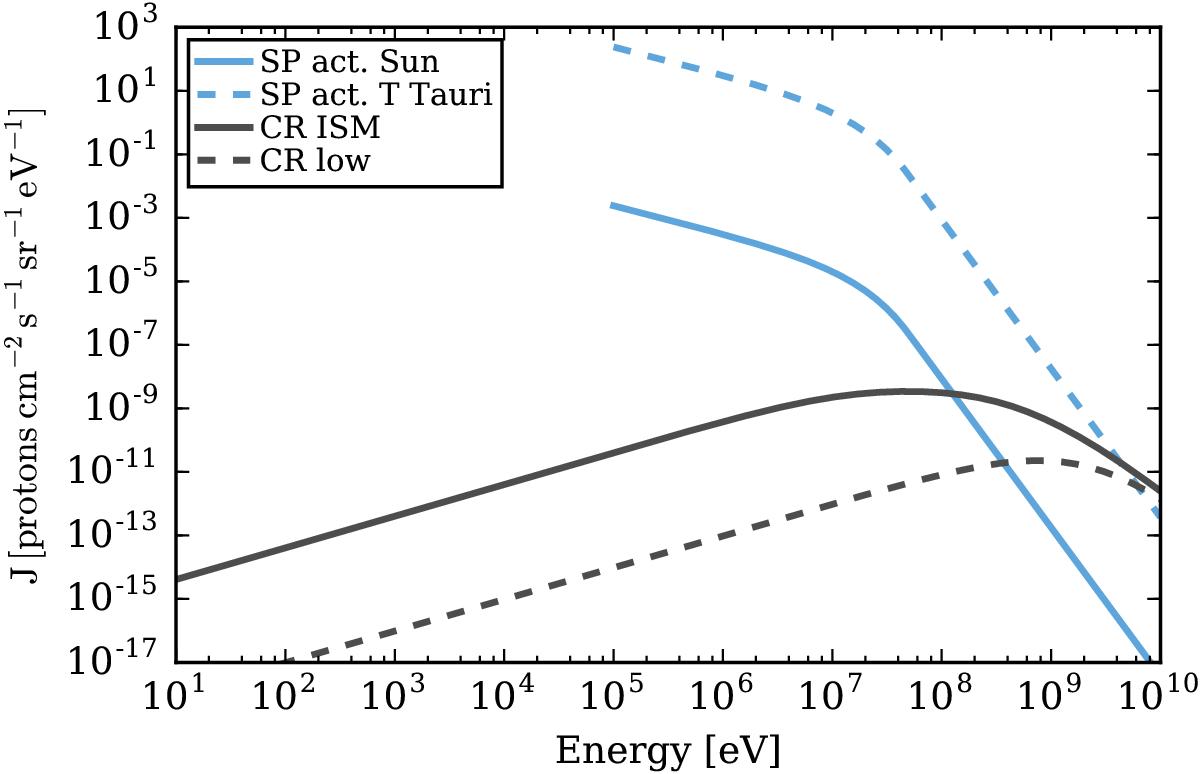
Stellar energetic proton (SP) and cosmic-ray (CR) input spectra. The blue solid and dashed lines show the active Sun and active T Tauri SP spectrum, respectively. The black solid line shows the “LIS W98” CR spectrum from Webber (1998) and the dashed black line the attenuated “Solar Max” CR spectrum from Cleeves et al. (2013).
Current usage metrics show cumulative count of Article Views (full-text article views including HTML views, PDF and ePub downloads, according to the available data) and Abstracts Views on Vision4Press platform.
Data correspond to usage on the plateform after 2015. The current usage metrics is available 48-96 hours after online publication and is updated daily on week days.
Initial download of the metrics may take a while.