Fig. 11
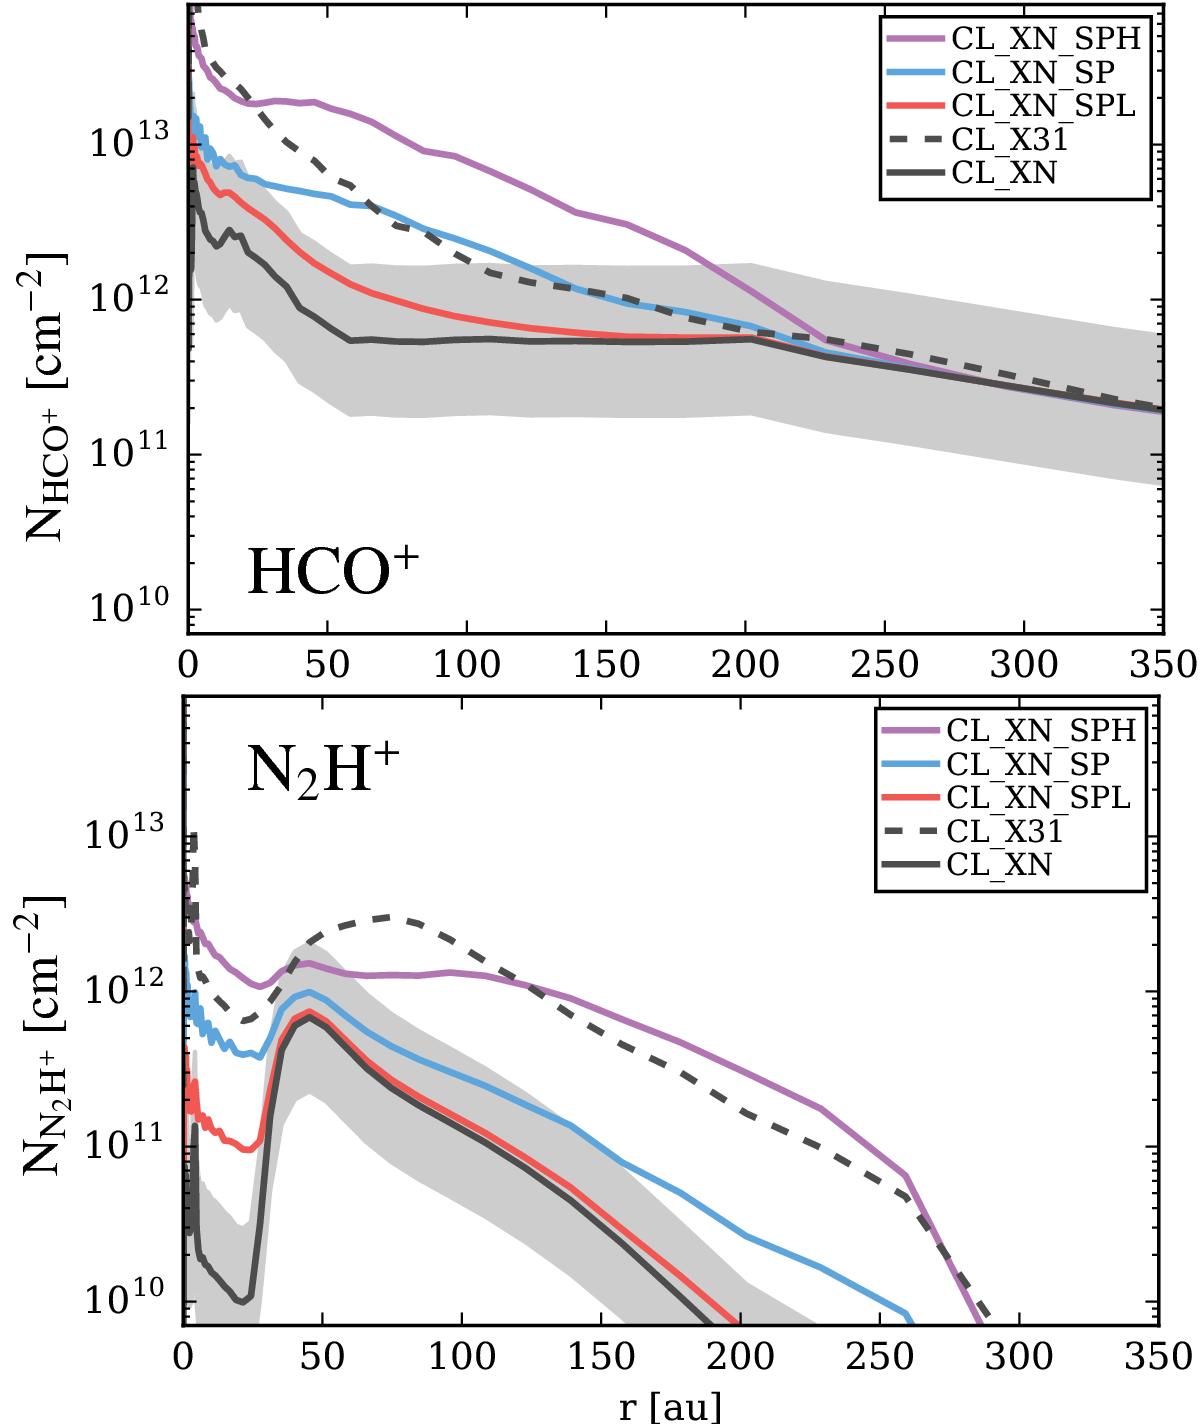
Comparison of column densities for HCO+ (top) and N2H+ (bottom) for models with varying SP flux and very strong X-ray emission. For all models the low CR ionization rates are used. Shown are the reference model with normal X-rays (black, CL_XN), the model with the typical SP flux (blue, CL_XN_SP) and models with a factor of ten higher (purple, CL_XN_SPH) and factor of ten lower (red, CL_XN_SPL) SP flux. The dashed black line shows the model with LX = 3 × 1031 erg s-1 and no SPs. The grey shaded area marks a difference of a factor of three in the column densities relative to the reference model CL_XN.
Current usage metrics show cumulative count of Article Views (full-text article views including HTML views, PDF and ePub downloads, according to the available data) and Abstracts Views on Vision4Press platform.
Data correspond to usage on the plateform after 2015. The current usage metrics is available 48-96 hours after online publication and is updated daily on week days.
Initial download of the metrics may take a while.