Fig. 10
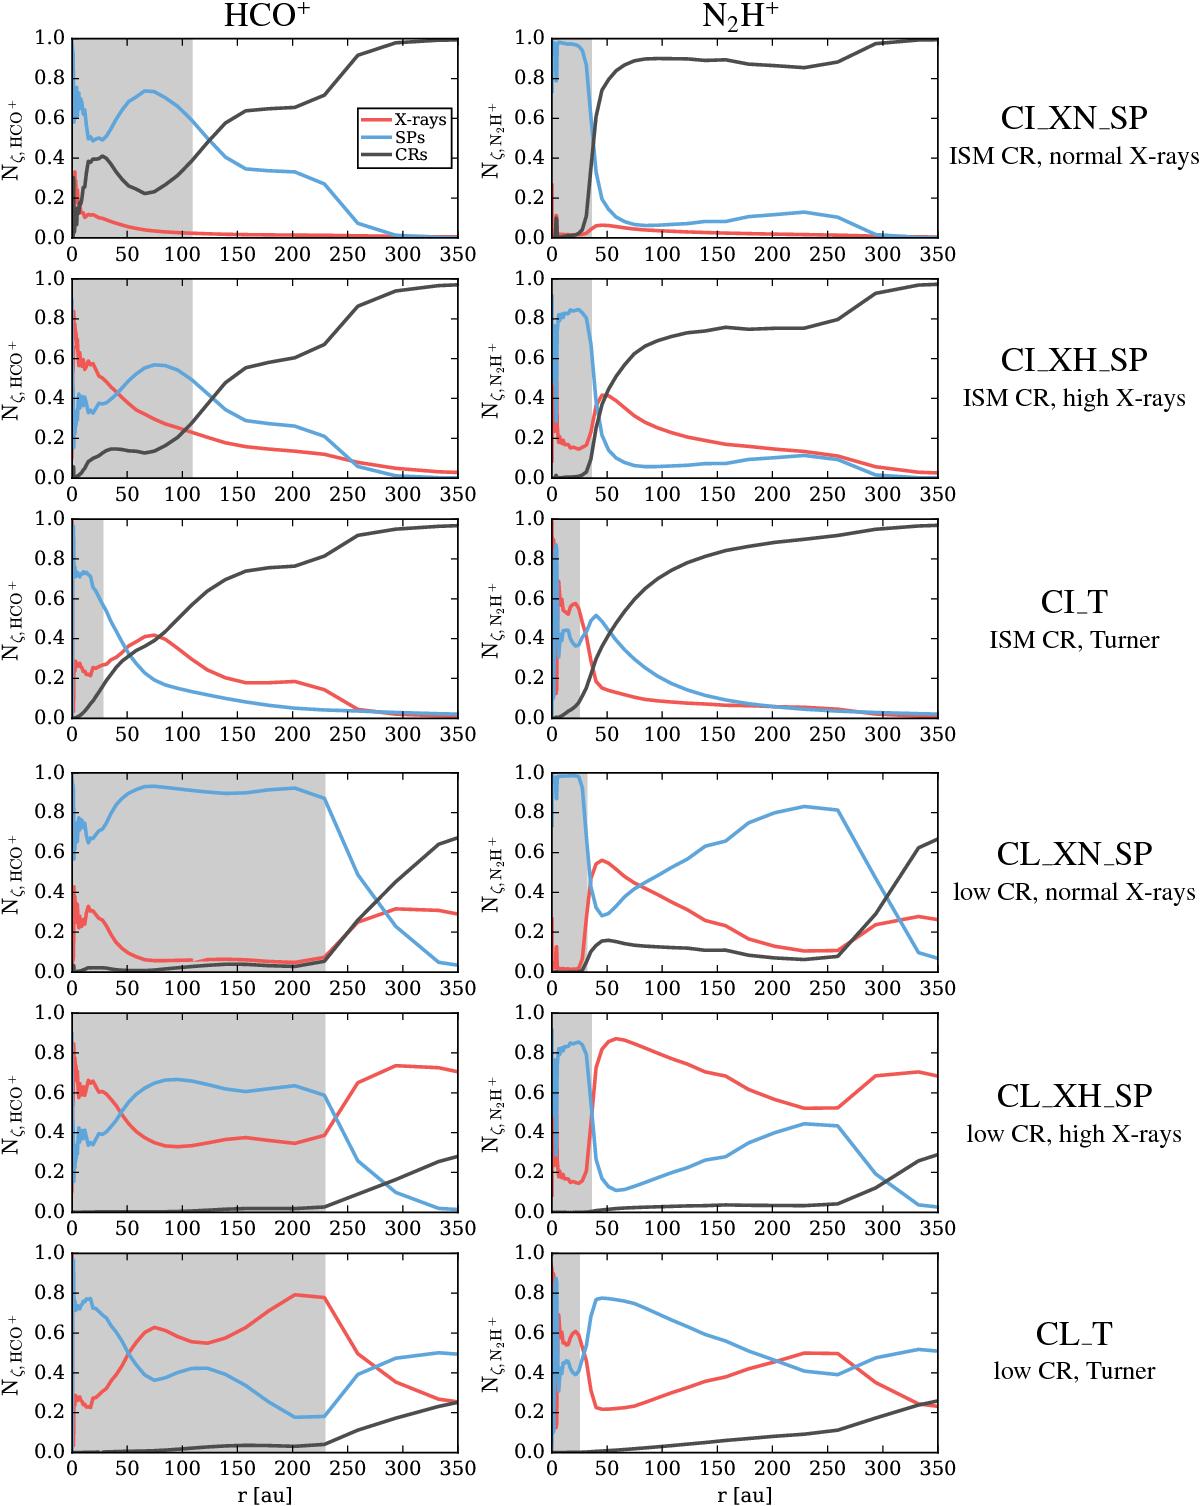
Ionization rate weighted column densities Nζ (Eq. (5)) as a function of radius for HCO+ (left column) and N2H+ (right column). Nζ is normalized to the total column density of the respective molecule. The individual colored solid lines show the fraction of the total column density dominated by a certain ionization source. Red is for X-rays (NζX), blue for SPs (NζSP) and black for CRs (NζCR). Each row corresponds to one model. On the right hand side the model descriptions are provided (see Table 5). The grey shaded area marks the region where more than 50% of the column density arise from regions above the CO ice line (i.e. the warm molecular layer).
Current usage metrics show cumulative count of Article Views (full-text article views including HTML views, PDF and ePub downloads, according to the available data) and Abstracts Views on Vision4Press platform.
Data correspond to usage on the plateform after 2015. The current usage metrics is available 48-96 hours after online publication and is updated daily on week days.
Initial download of the metrics may take a while.