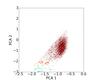
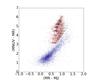
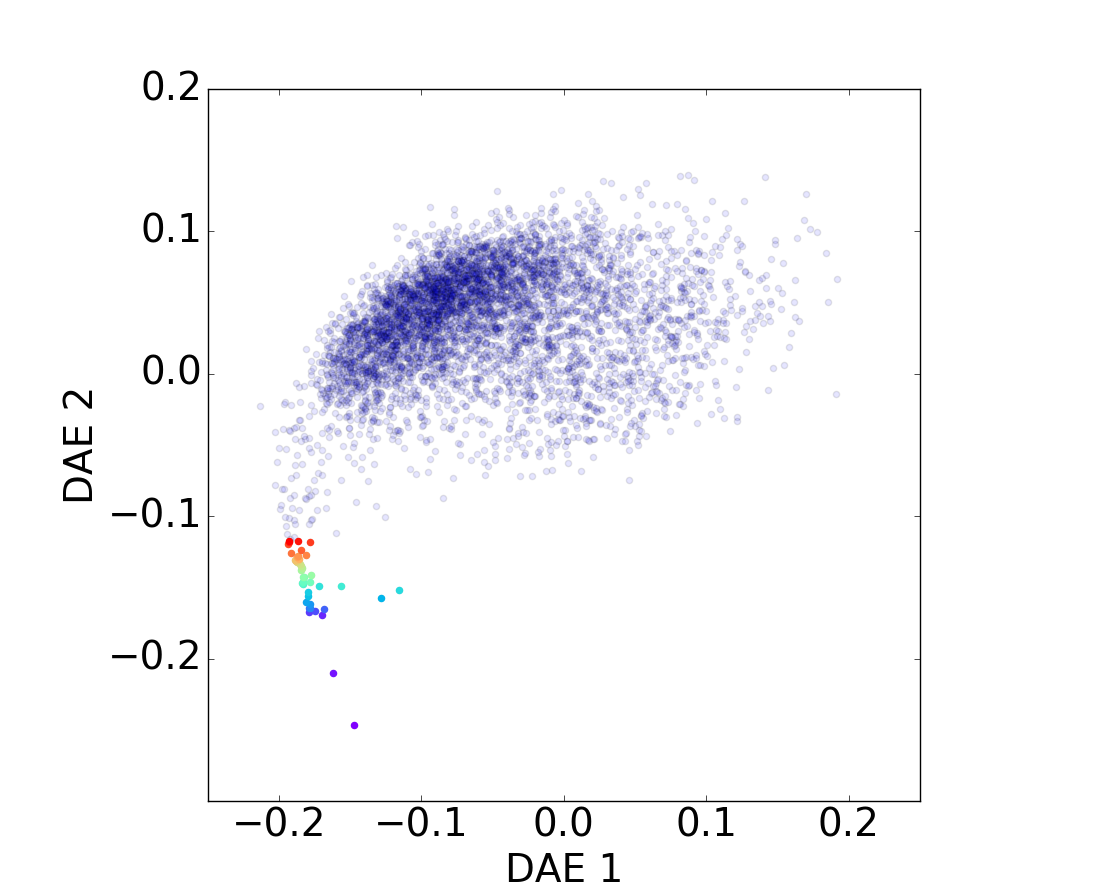
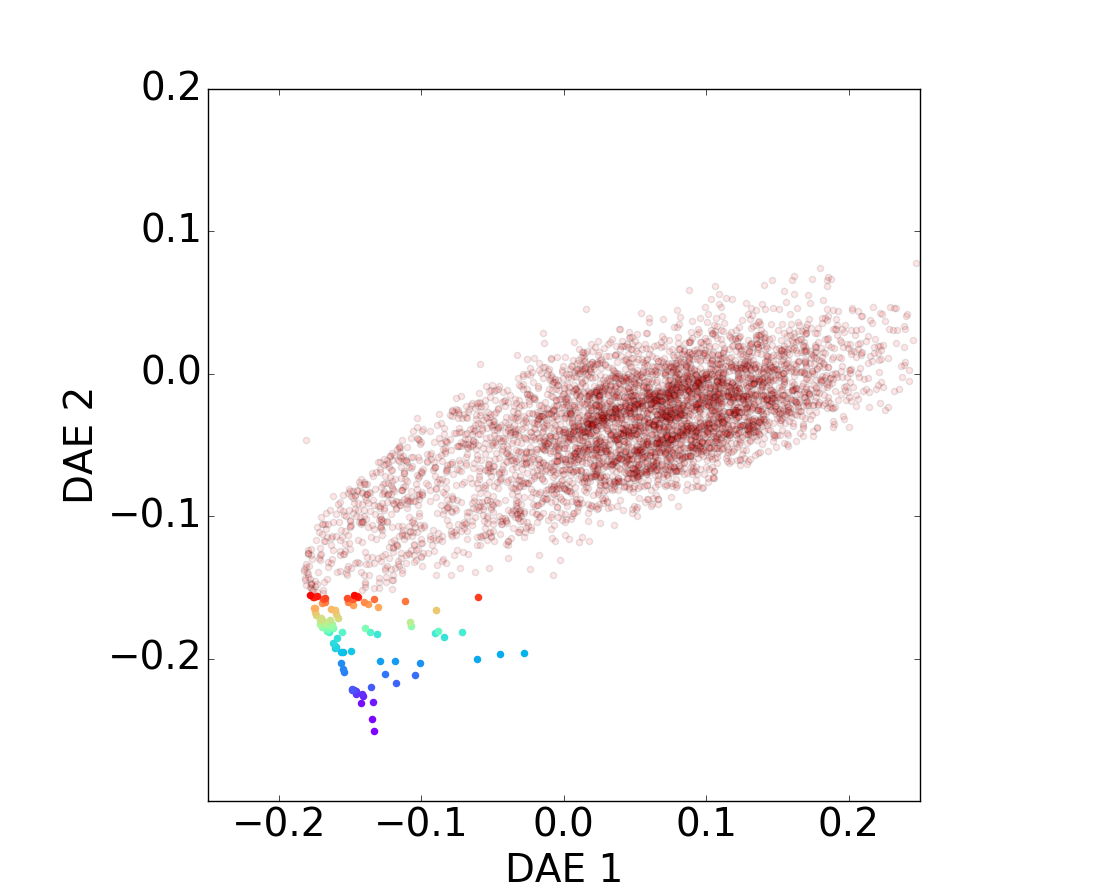
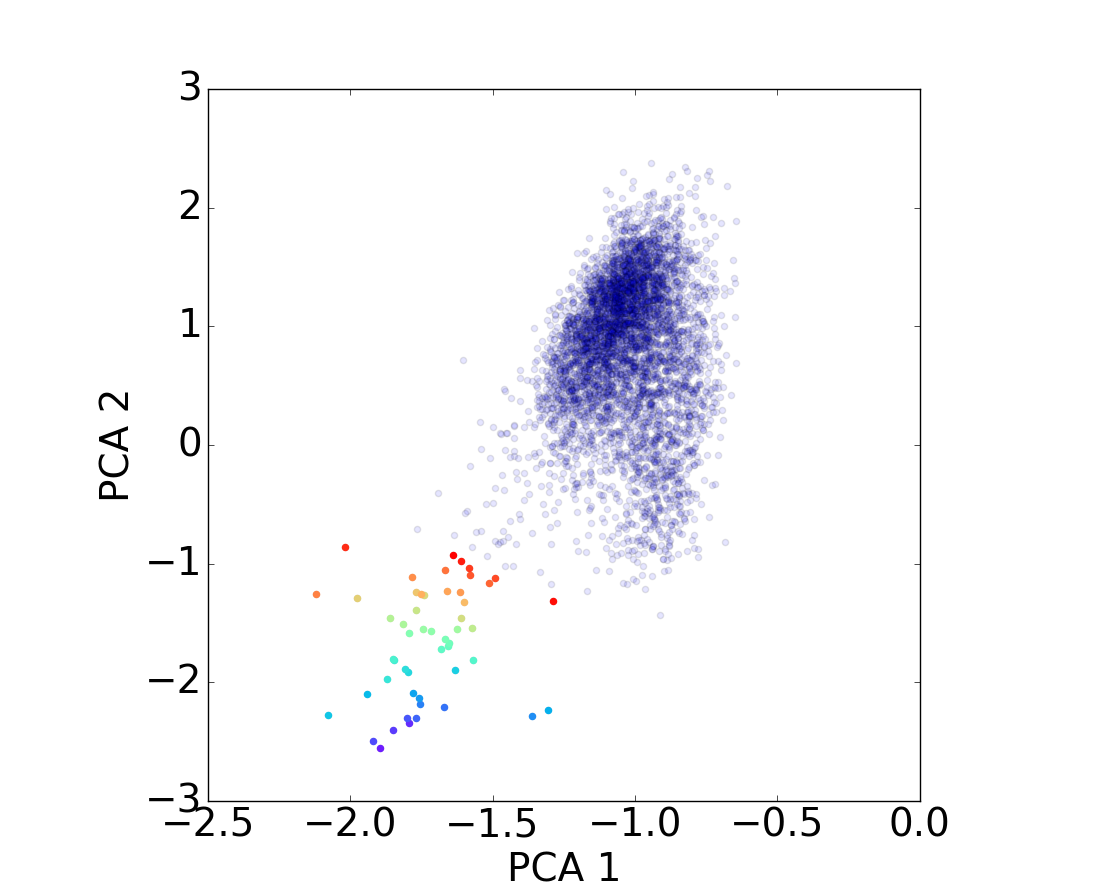
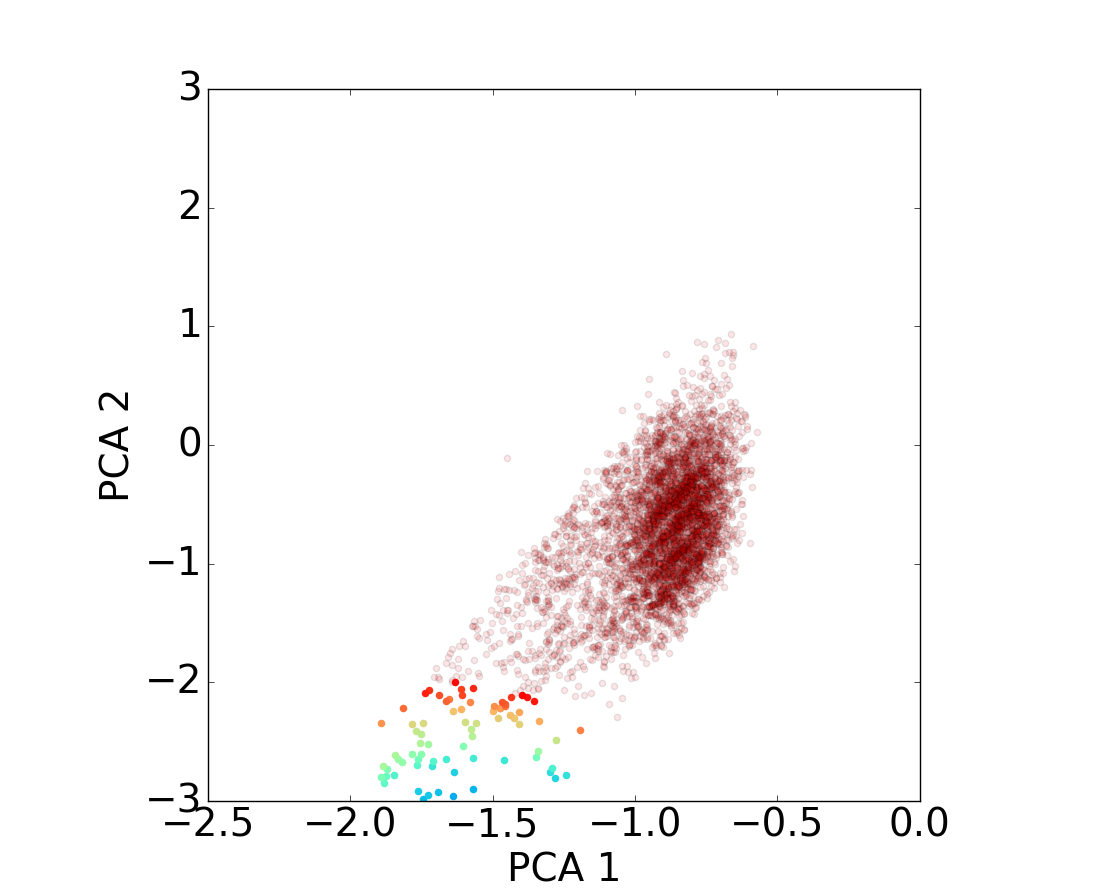
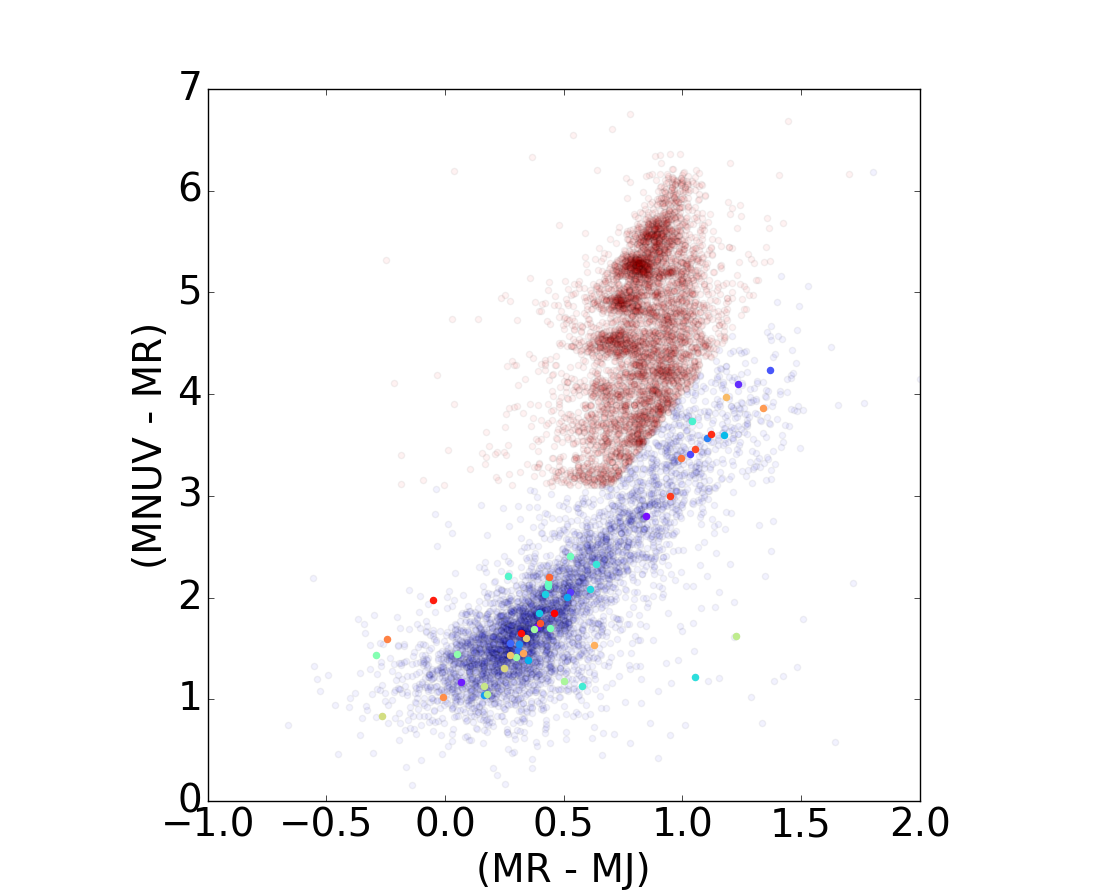
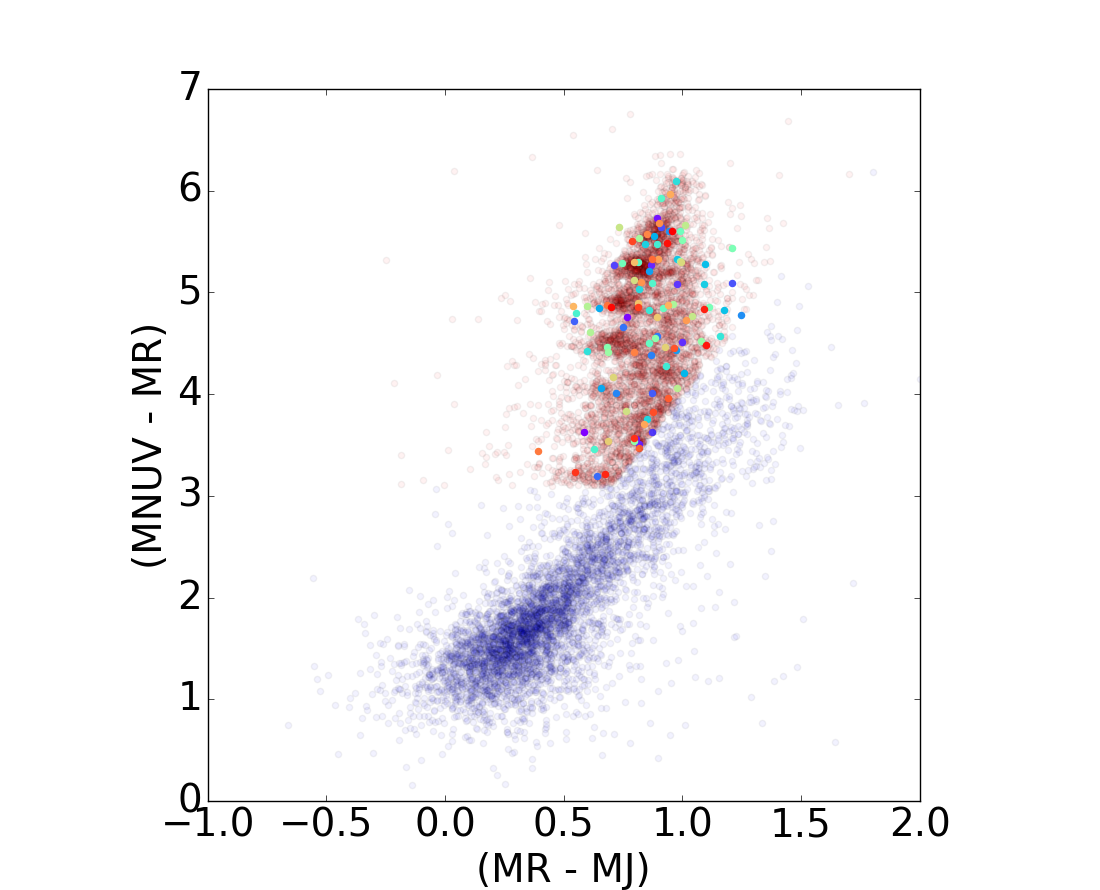
Fig. 8
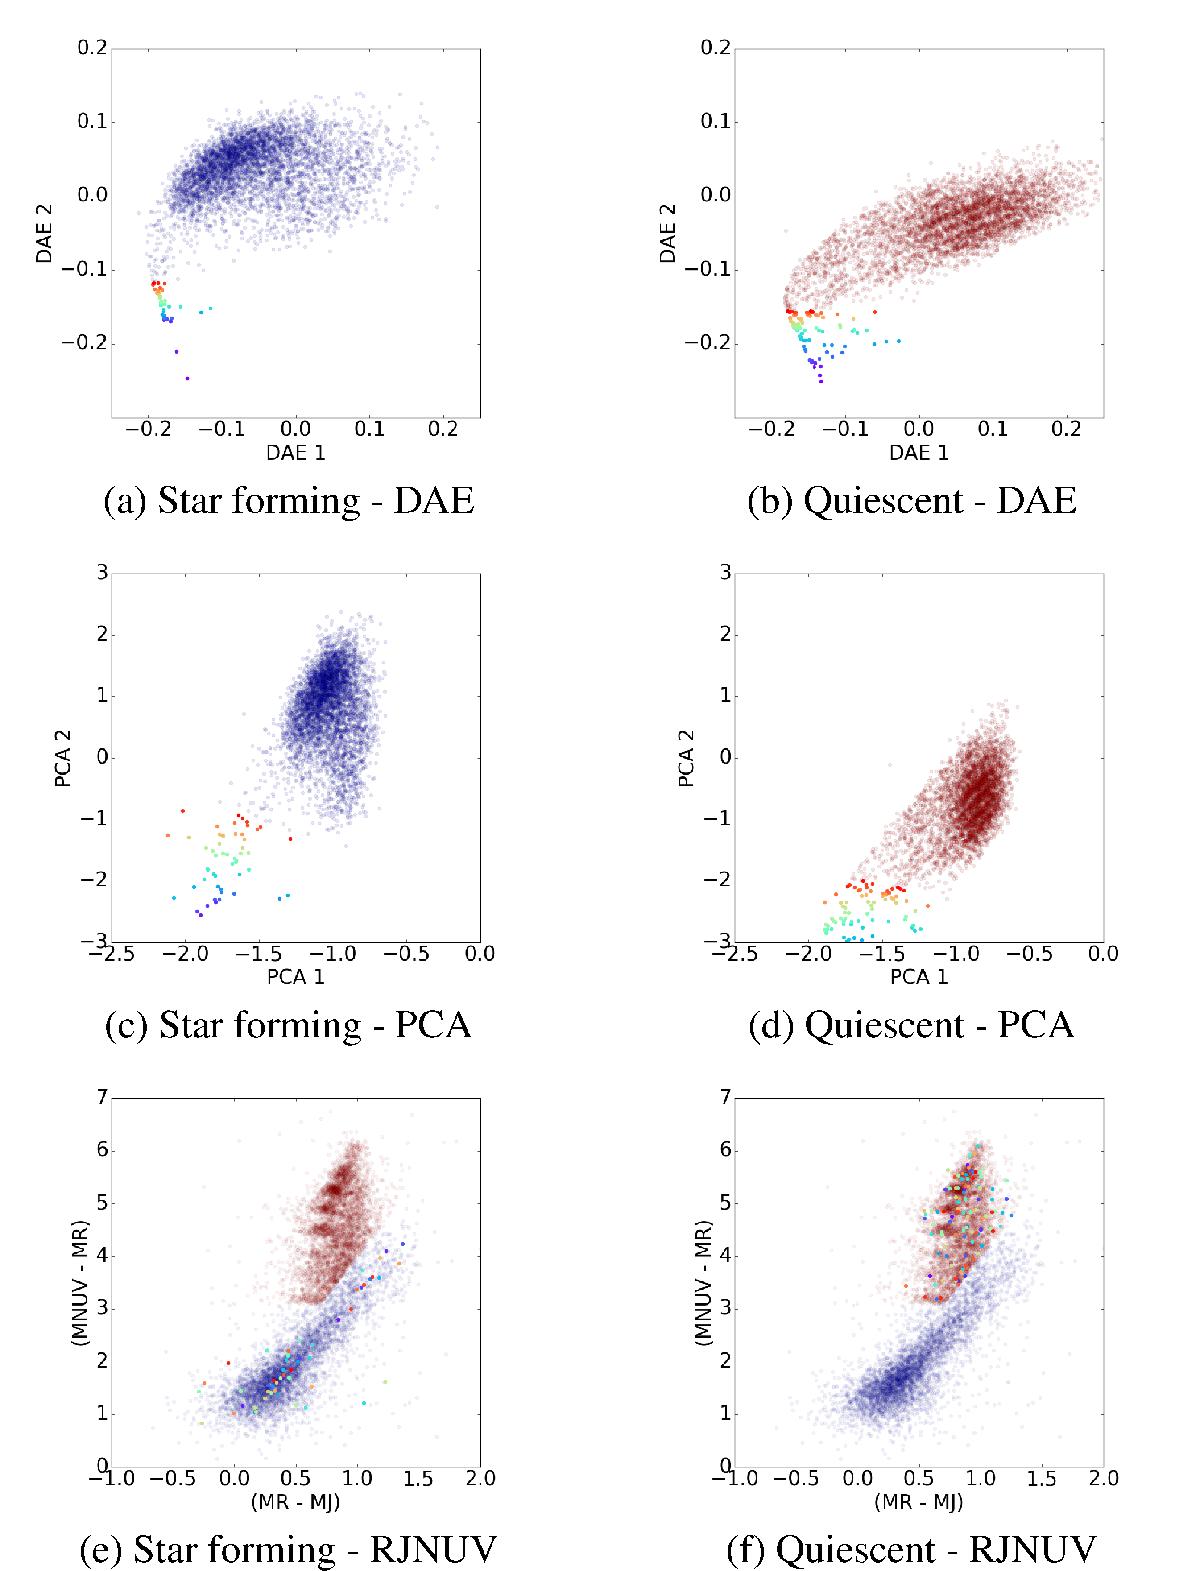
Projection of the structured queues identified in the DAE diagram, a) and b), back to the PCA diagram, c) and d), and to the RJ − NUVR diagram, e) and f). Top figures display star-forming populations in blue a) and quiescent sources in red b) for the test set. Galaxies located in the queues are highlighted on the DAE diagram and projected back to the PCA diagram and to the RJ − NUVR plane following the same color code. It is clear that these structures do not correspond to a particular disposition on the RJ − NUVR diagram and that they present a similar pattern on the PCA and DAE diagrams.

Current usage metrics show cumulative count of Article Views (full-text article views including HTML views, PDF and ePub downloads, according to the available data) and Abstracts Views on Vision4Press platform.
Data correspond to usage on the plateform after 2015. The current usage metrics is available 48-96 hours after online publication and is updated daily on week days.
Initial download of the metrics may take a while.