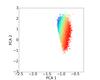
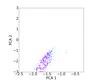
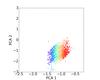
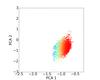
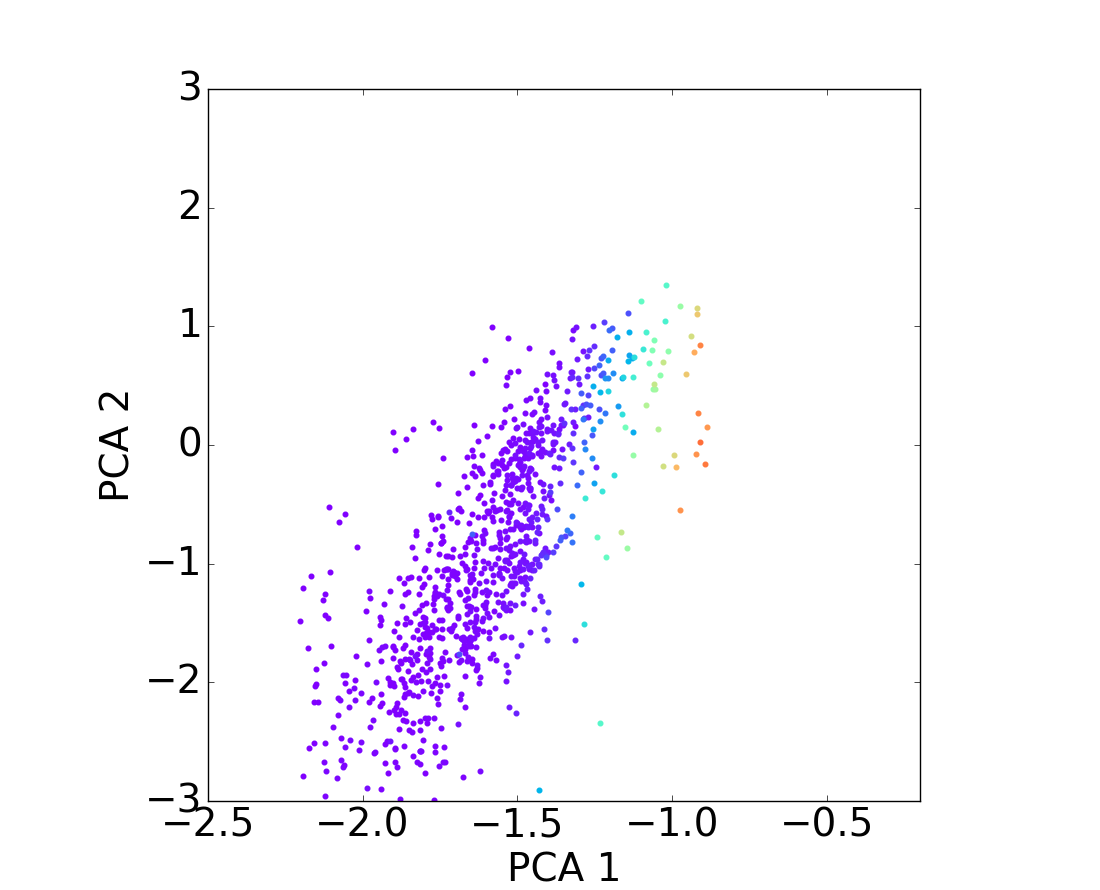
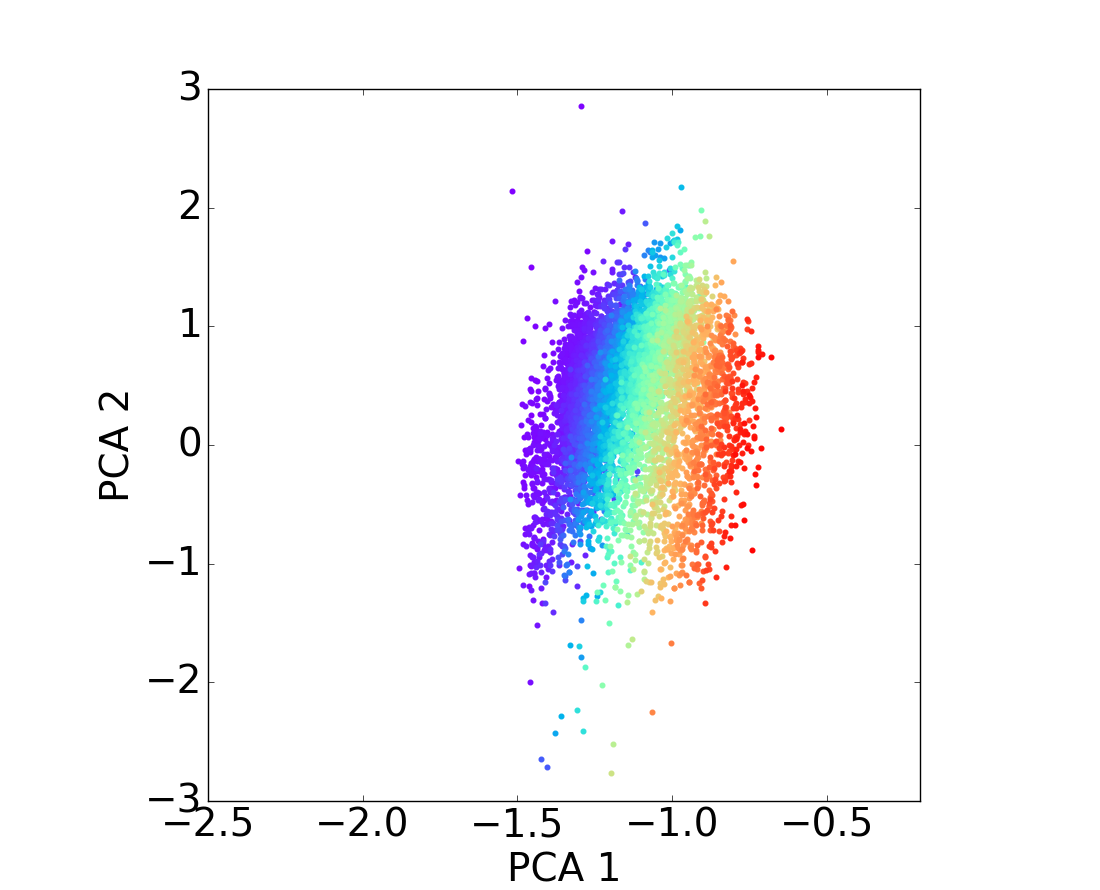
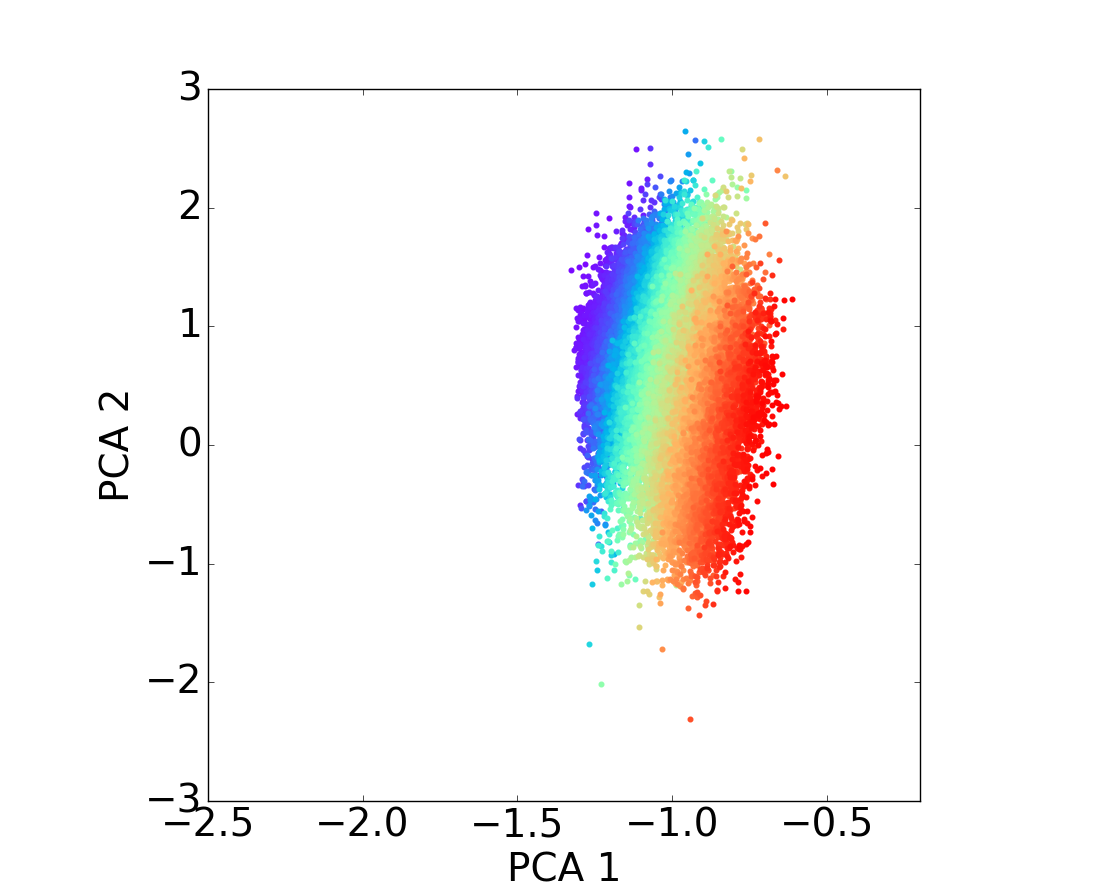
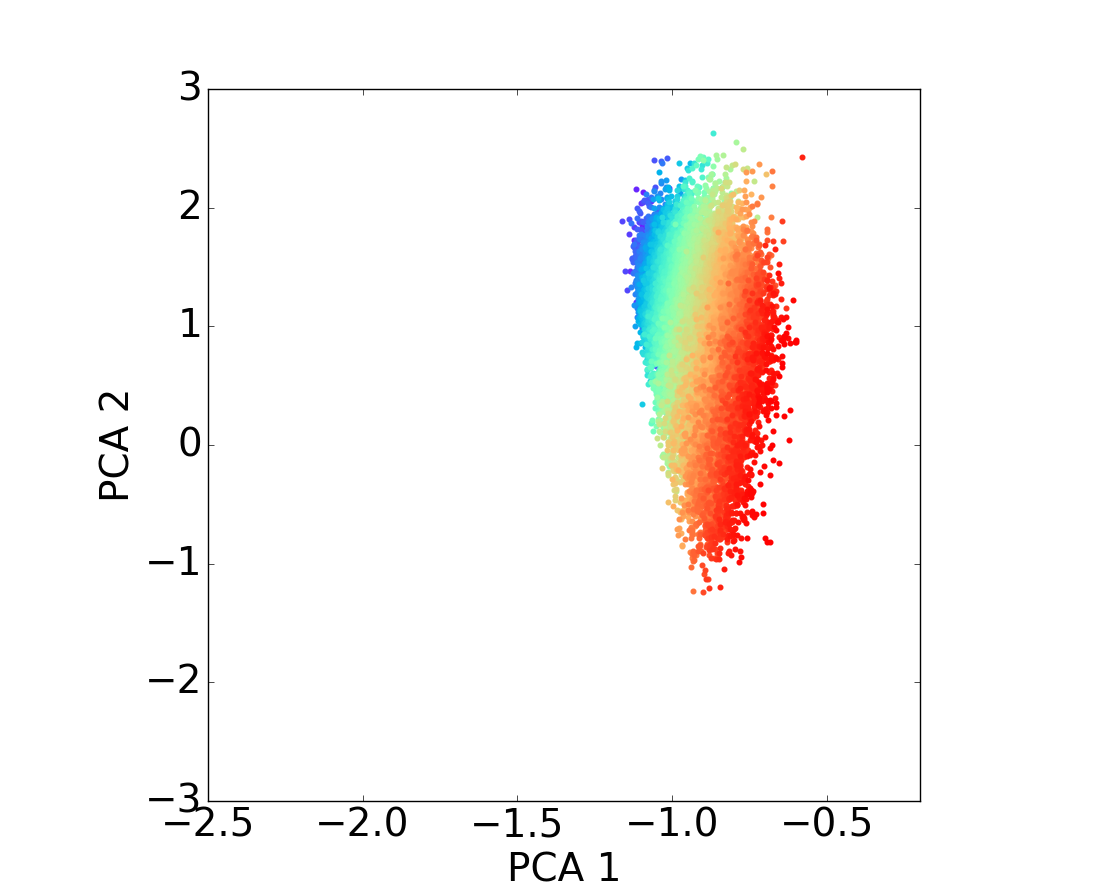
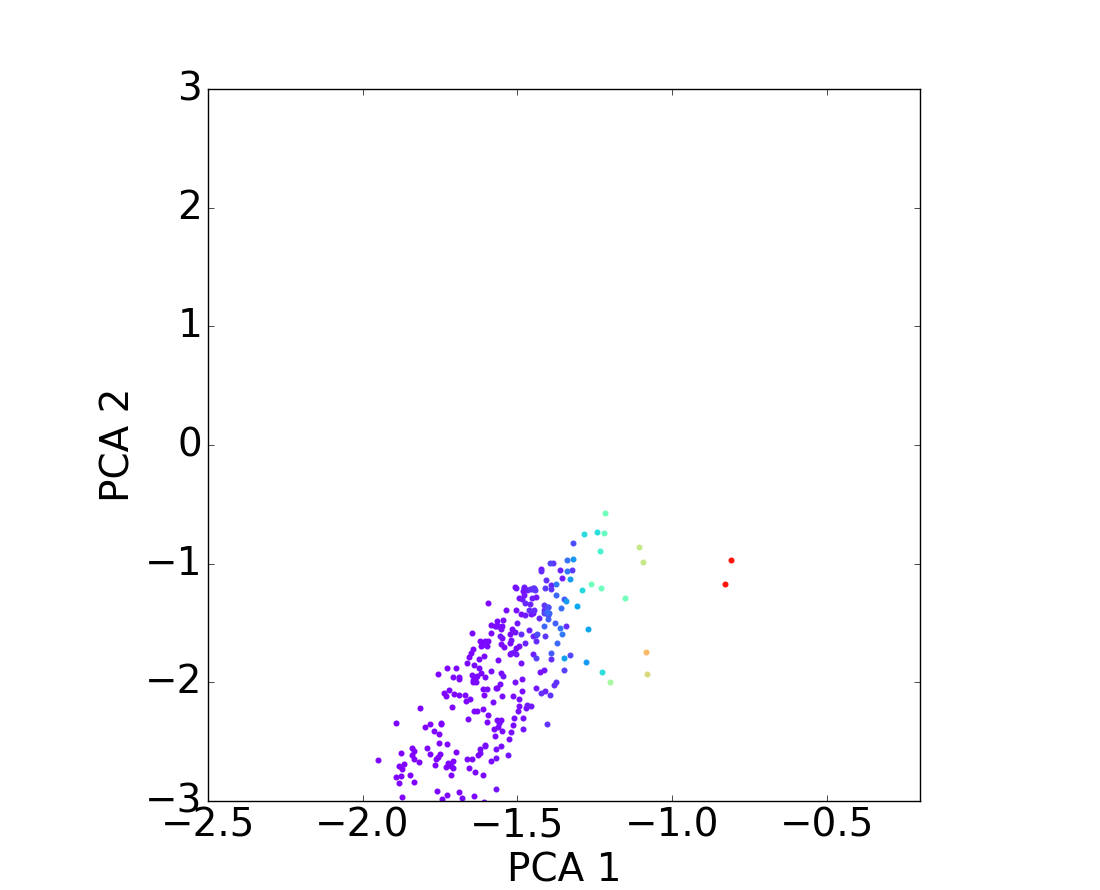
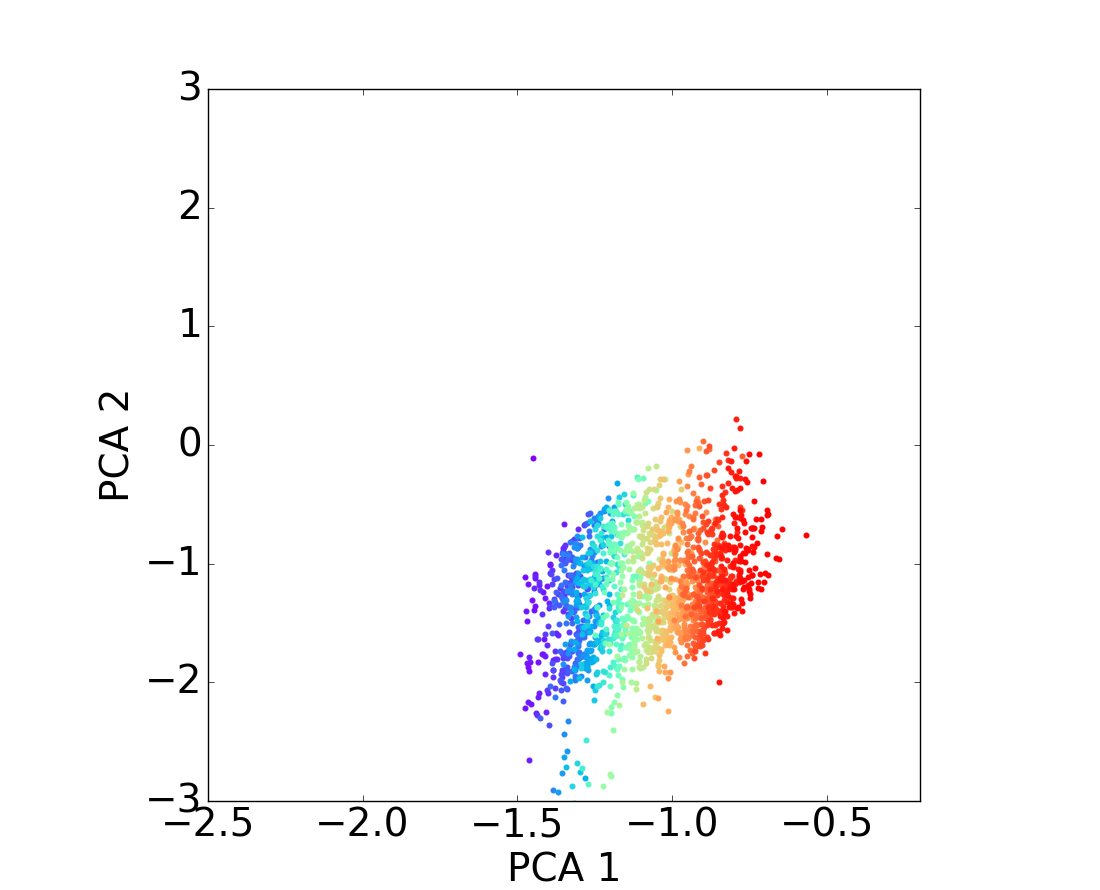
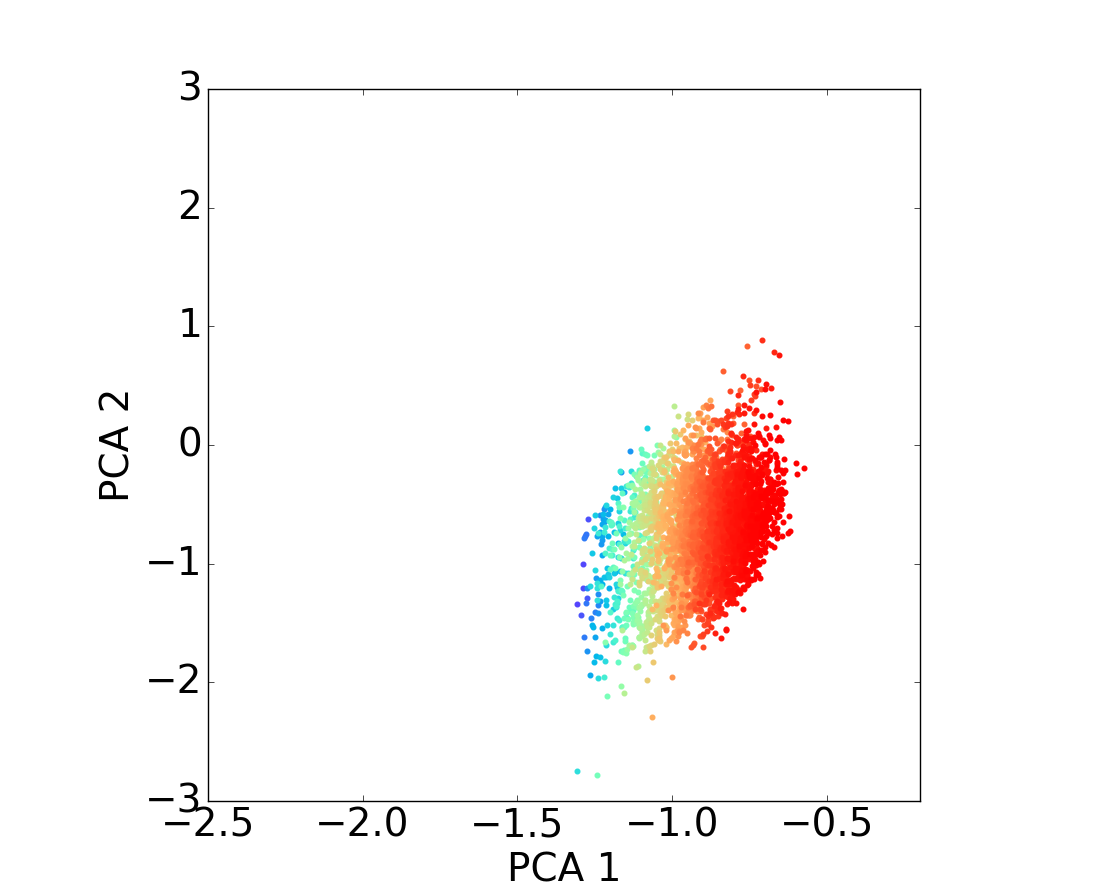
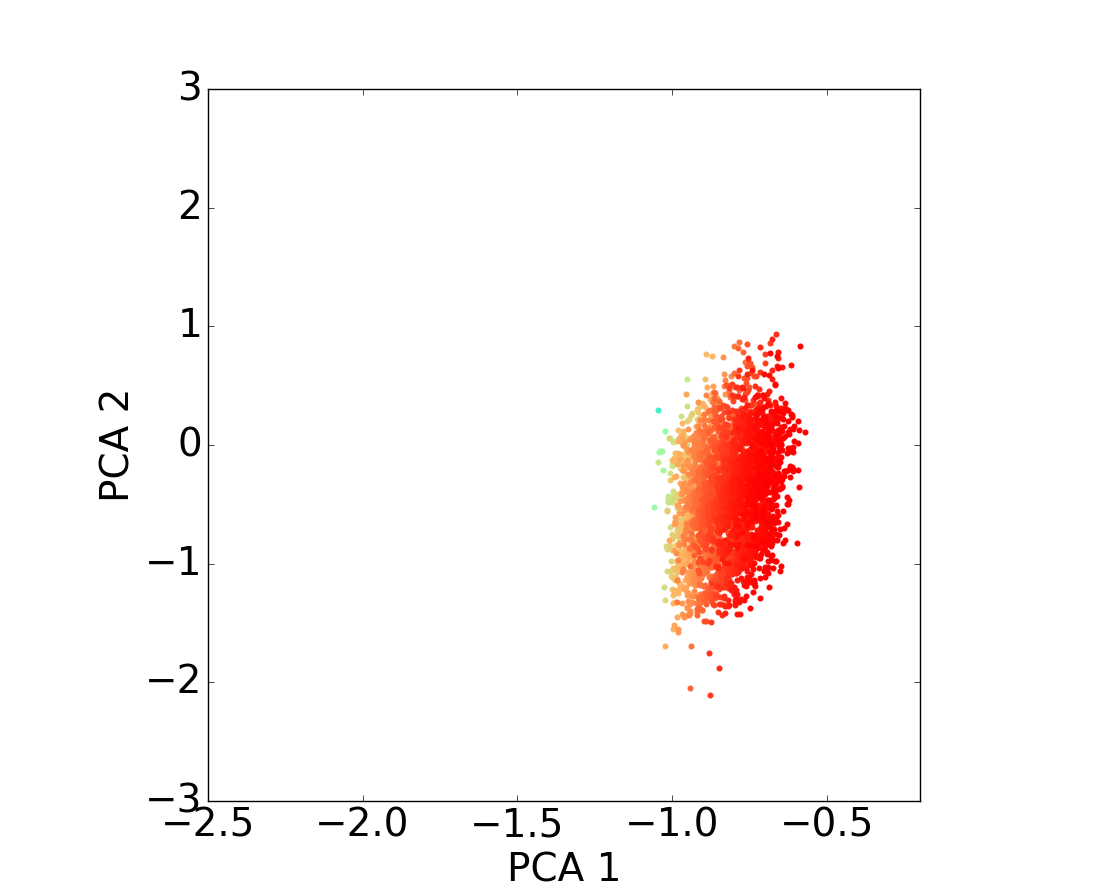
Fig. 10
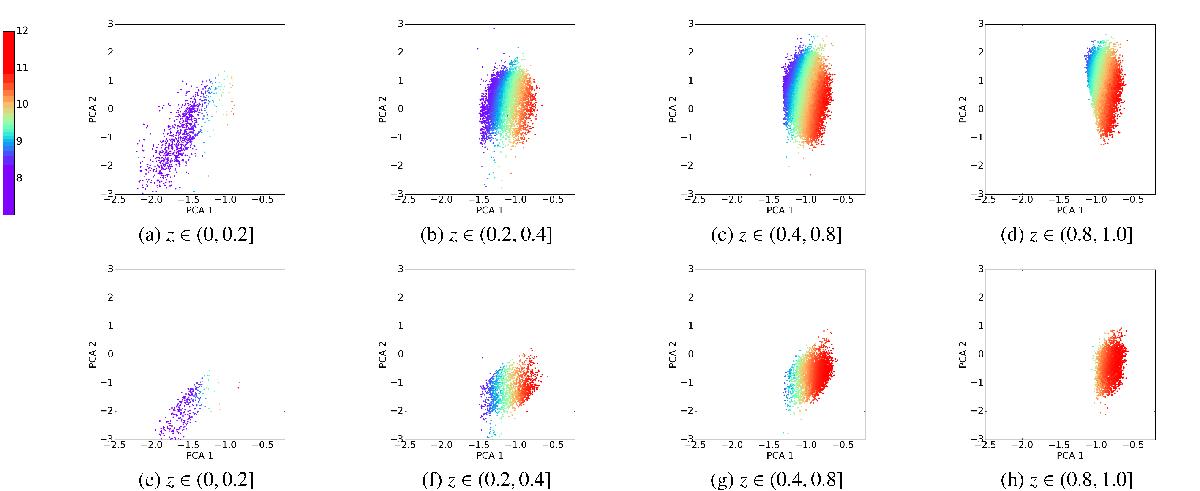
Distribution of the mass of the galaxies on the PCA diagram through the different redshift bins. As above, figures on top row correspond to star-forming populations for different redshift bins and figures on the bottom to quiescent populations for the same redshift bins; and the color code matches the galaxy stellar mass taken from the COSMOS2015 catalog. From these figures, it is easy to notice a strong relationship between the first PCA component and the stellar mass.
Current usage metrics show cumulative count of Article Views (full-text article views including HTML views, PDF and ePub downloads, according to the available data) and Abstracts Views on Vision4Press platform.
Data correspond to usage on the plateform after 2015. The current usage metrics is available 48-96 hours after online publication and is updated daily on week days.
Initial download of the metrics may take a while.