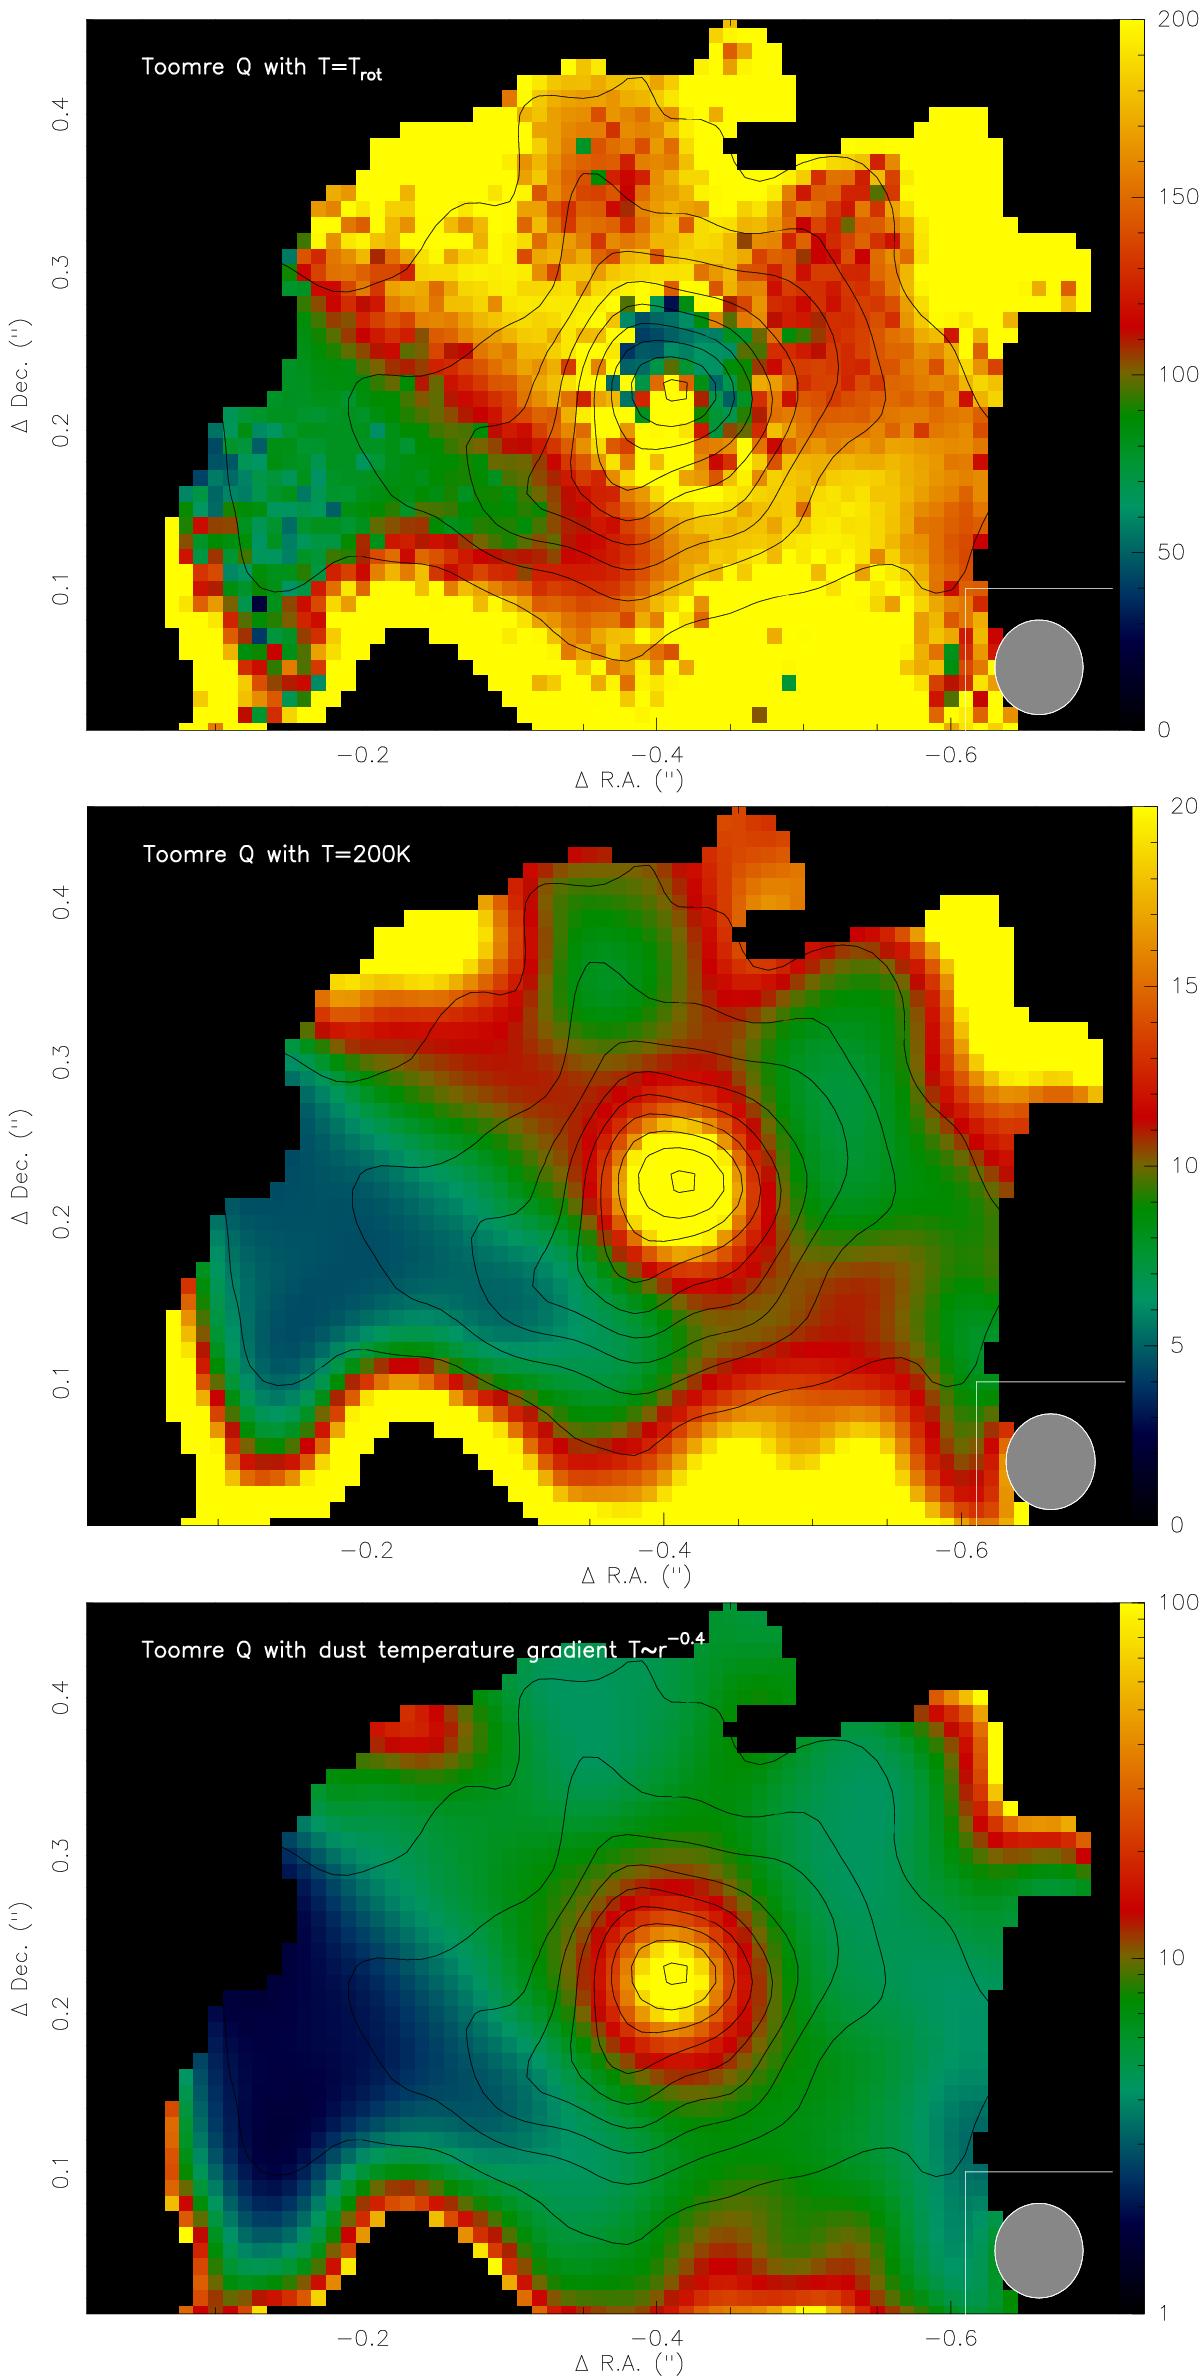
Fig. 12

Color-scales showing in all three panels the Toomre Q map (see text for details) of the disk seen toward source #1. While the top panel uses the rotational temperature derived from CH3CN (Fig. 10) at each pixel to determine the sound speed and column density, the middle panel uses a uniform lower temperature of 200 K for these estimates. The lower panel uses a dust temperature distribution of T ∝ r-0.4 for the calculations (see Sect. 4.3). The black contours show in each panel the 438 μm continuum emission in 4σ steps of 28 mJy beam-1. Toomre Q values outside the CH3CN(372−362) 3σ level (Fig. 10) are clipped out. The beam is shown at the bottom right of each panel.
Current usage metrics show cumulative count of Article Views (full-text article views including HTML views, PDF and ePub downloads, according to the available data) and Abstracts Views on Vision4Press platform.
Data correspond to usage on the plateform after 2015. The current usage metrics is available 48-96 hours after online publication and is updated daily on week days.
Initial download of the metrics may take a while.


