Fig. 5
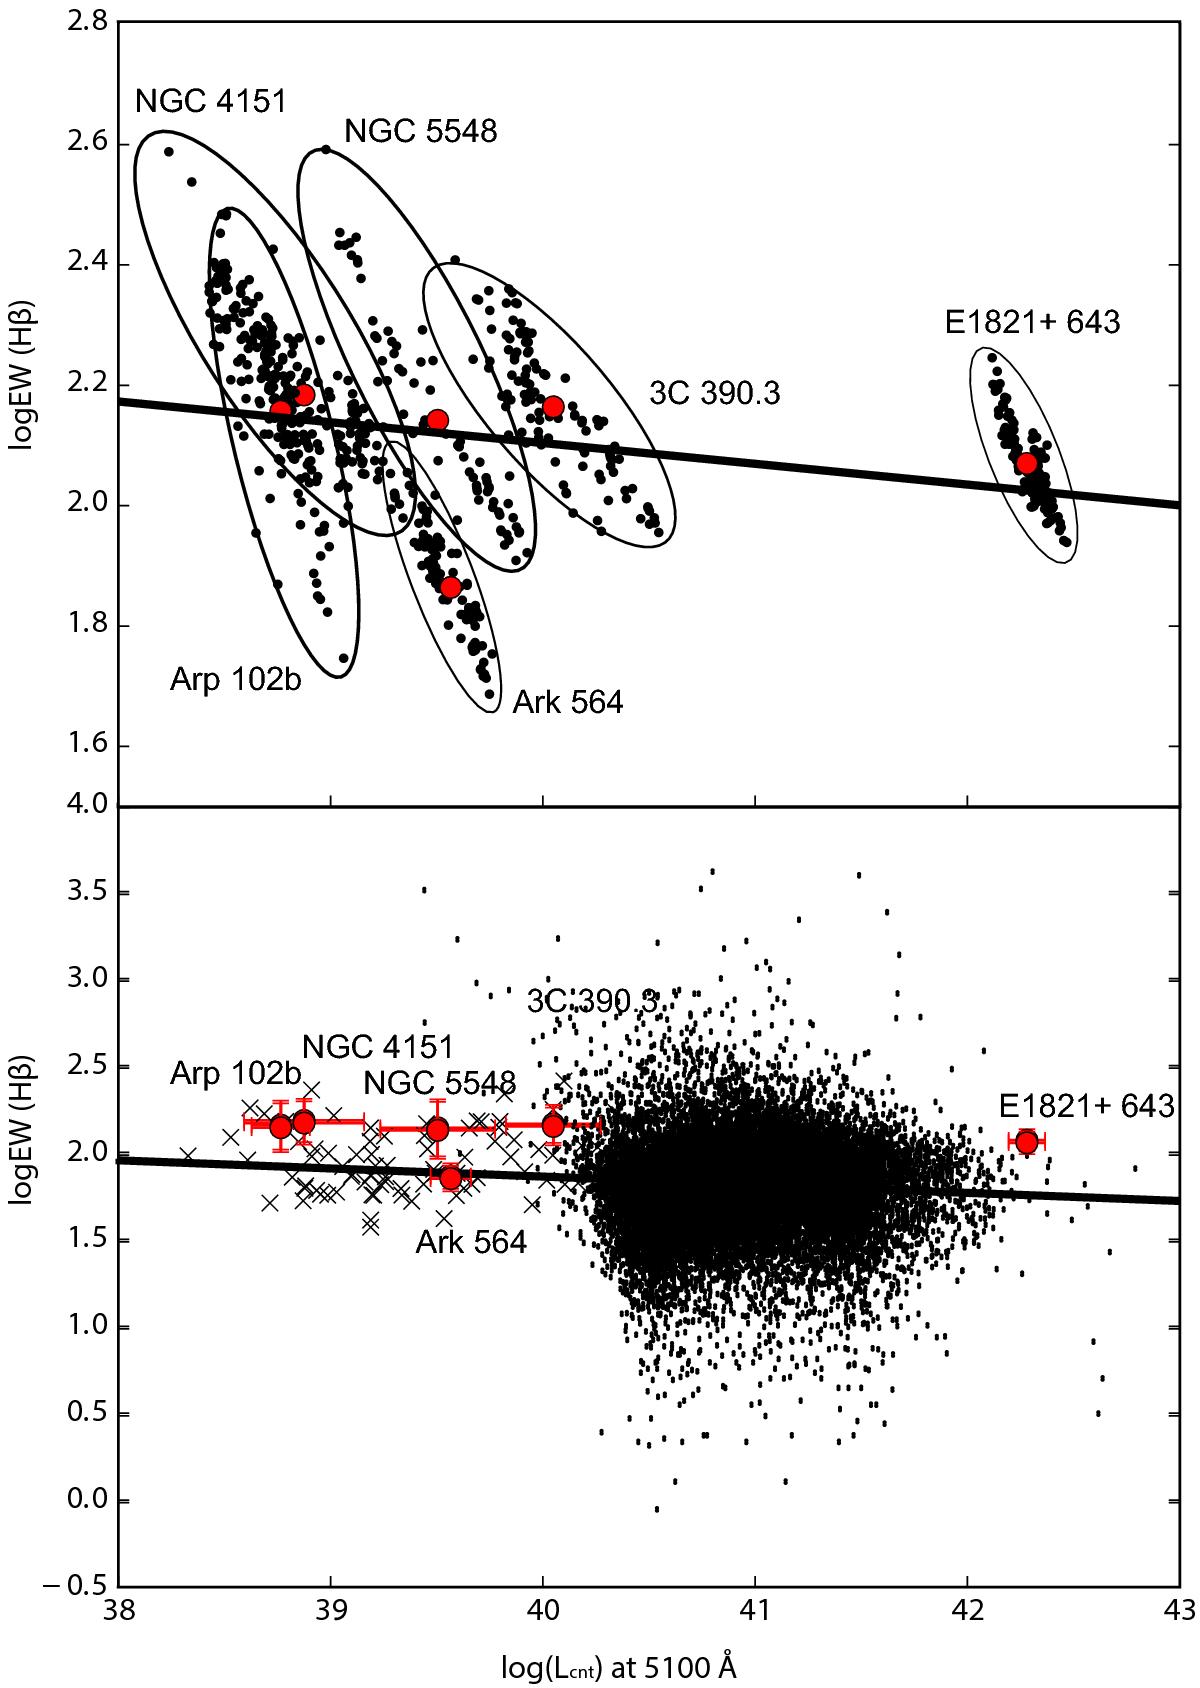
Global Beff for Hβ. Top: for our samples of six AGNs, we plot the Hβ line EW and continuum luminosity at 5100 Å (dots surrounded with contours). The corresponding averaged line EW and continuum luminosity is denoted with a circle for each object. The best-fitting of all the measurements for the six objects is shown with the solid line. Bottom: averaged values of the six studied objects (circles), together with the sample of 21 416 AGNs measured by Shen et al. (2011; dots) and 90 low-luminosity AGNs from La Mura et al. (2007; crosses). The best-fitting of all data is shown with the solid line.
Current usage metrics show cumulative count of Article Views (full-text article views including HTML views, PDF and ePub downloads, according to the available data) and Abstracts Views on Vision4Press platform.
Data correspond to usage on the plateform after 2015. The current usage metrics is available 48-96 hours after online publication and is updated daily on week days.
Initial download of the metrics may take a while.